





TL;DRInfographics are one of the best ways to engage, educate, and convert. Want your message to stick? Focus on clear visuals, concise content, and mobile-friendly design. Stay on top with the latest infographic design trends in 2026, like motion graphics and AI-generated visuals. INKLUSIVE delivers custom infographic design services that get real results.Not too long ago, I was in a meeting where someone flashed a 30-slide deck full of bullet points and bar graphs.
Five minutes in, I was already zoning out—and I wasn’t the only one.
Eyes glazed over. Phones magically appeared. The message? Completely lost.
That’s when it hit me: we don’t have an attention problem—we have a communication problem.
Enter infographics.
In a world overflowing with data, deadlines, and distractions, businesses need to cut through the noise by using visual representations effectively, particularly through data visualization. That’s exactly where infographic examples step in as the silent heroes of modern communication. They take the complicated and make it digestible, fast, and beautiful with illustrations.
Whether you’re presenting key data, quarterly stats, simplifying your product journey, or selling an idea to a tough crowd, the best infographic designs don’t just convey information—they spark understanding and action.
And here’s the thing: people don’t remember numbers, they remember visuals. That’s why infographic examples for business have become a non-negotiable part of storytelling—internal decks, client pitches, marketing campaigns, and important details, you name it; they serve as a good example of effective communication.
In this blog, we’re not just sharing designs—we’re walking through 34 powerful infographic examples you can learn from, steal ideas from (we won’t tell!), and reimagine for your brand in 2026.
Ready to make your message unforgettable? Let’s go.
Why Infographics Still Rule in 2026
Let’s be real, business communication in 2026 is wild. Everyone’s chasing the same three things: attention, clarity, and trust. But not everyone gets them.
Emails get skimmed. Reports get buried. Zoom calls? Half the team is multitasking or checking Slack, losing the reader’s attention. But visuals? They draw more attention and break through.
According to a study, 65% of brands now use infographics as part of their core content strategy, up from just 9% a decade ago.
Why?
Because visuals are processed 60,000x faster in the brain than text, and people actually remember them.
What this means for you: Whether you’re pitching to investors, onboarding new employees, or trying to explain a product feature to a client who “isn’t technical,” infographic examples for business are your cheat code to make it click.
They’re not just “nice to have” anymore. They’re your secret weapon.
Data is boring. Infographics make it sing and can also be fun.
Here’s the brutal truth: raw data is boring. Spreadsheets give people anxiety. Paragraphs packed with stats get ignored. And that’s a problem, because data = value and needs to be presented in a visually appealing manner.
Now flip it: Turn that same data into a visual journey—arrows, icons, flowcharts, a splash of color—and boom, you’ve got engagement. Suddenly, people care.
A study from HubSpot found that content with visuals gets 94% more views than content without.
And the cherry on top? People are 323% better at following directions with visuals than without.
That’s why the smartest brands are investing in infographic examples for business—because they know that clarity wins deals, and effective infographic design stories told visually stick.
34 Best Infographic Examples for Business in 2026
Each of these infographic examples shows how design can do more than look pretty — it can drive action, explain complexity, and elevate your brand. Whether you’re in tech, sales, HR, or education, there’s a visual format tailored to your communication needs.
1) Customer Journey Infographic (Marketing)
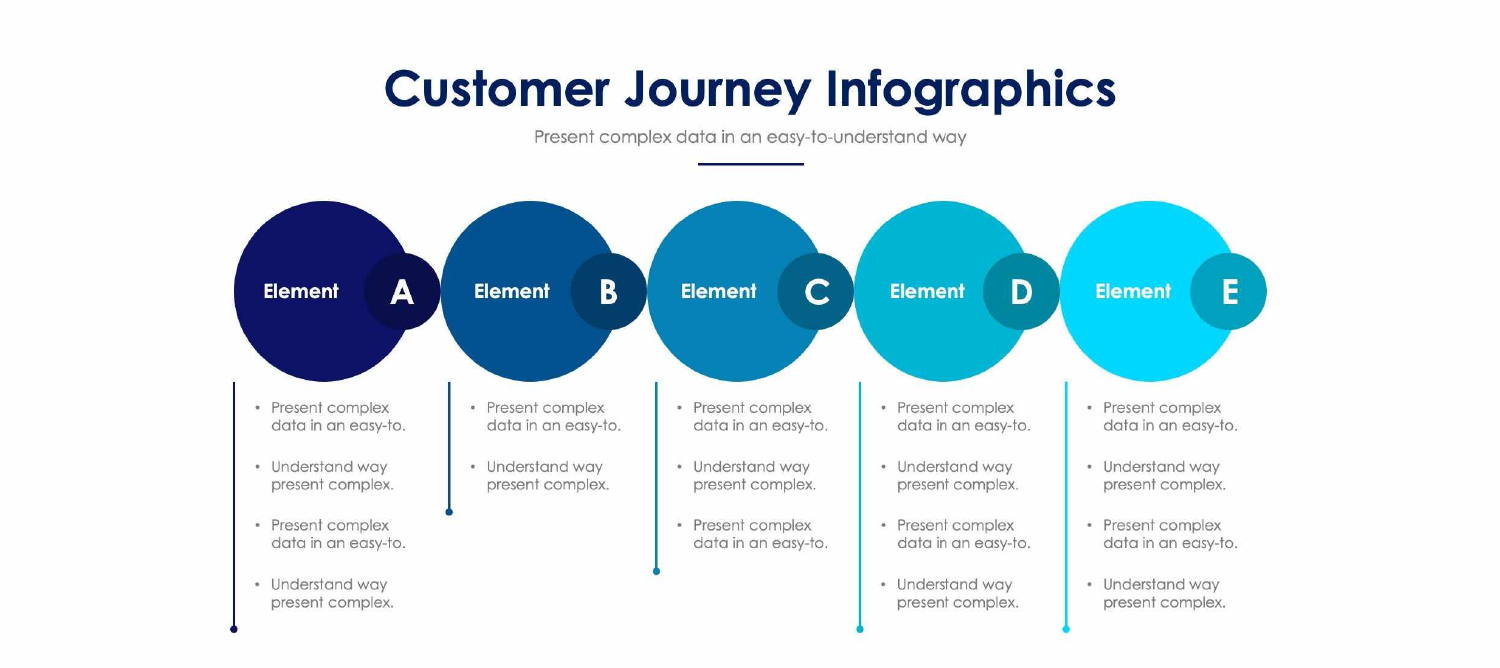
This is one of the best infographic designs for turning abstract funnel theories into real, relatable visuals. It maps the entire customer journey—from awareness to advocacy—with icons, color-coded stages, and pain points clearly marked. These infographic examples for business help marketing and CX teams align messaging across touchpoints and boost conversion strategies. Perfect for presentations, internal workshops, or campaign planning. It’s empathy in design form, and yes, it moves both hearts and numbers.
2) Process Infographic (Operations)
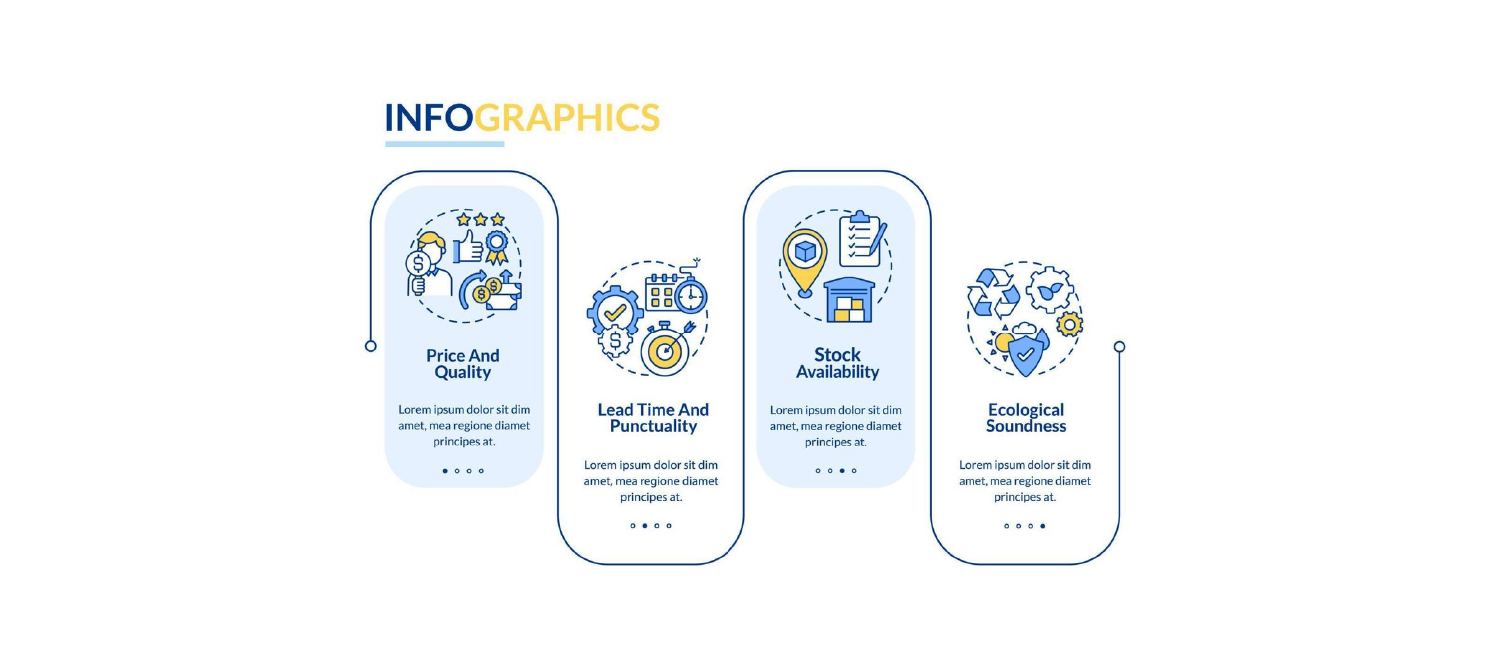
Process infographics are the backbone of clarity in any ops-heavy team. They turn chaos into choreography by laying out tasks, workflows, or systems in easy-to-follow steps. These infographic examples make onboarding, training, and SOPs a breeze. Use icons, numbered flows, and arrows to guide the eye.
For businesses that scale fast or rely on precision, this is one of those infographic examples for businesses that saves hours and prevents “Can you explain this again?” forever.
3) Comparison Infographic (Sales)
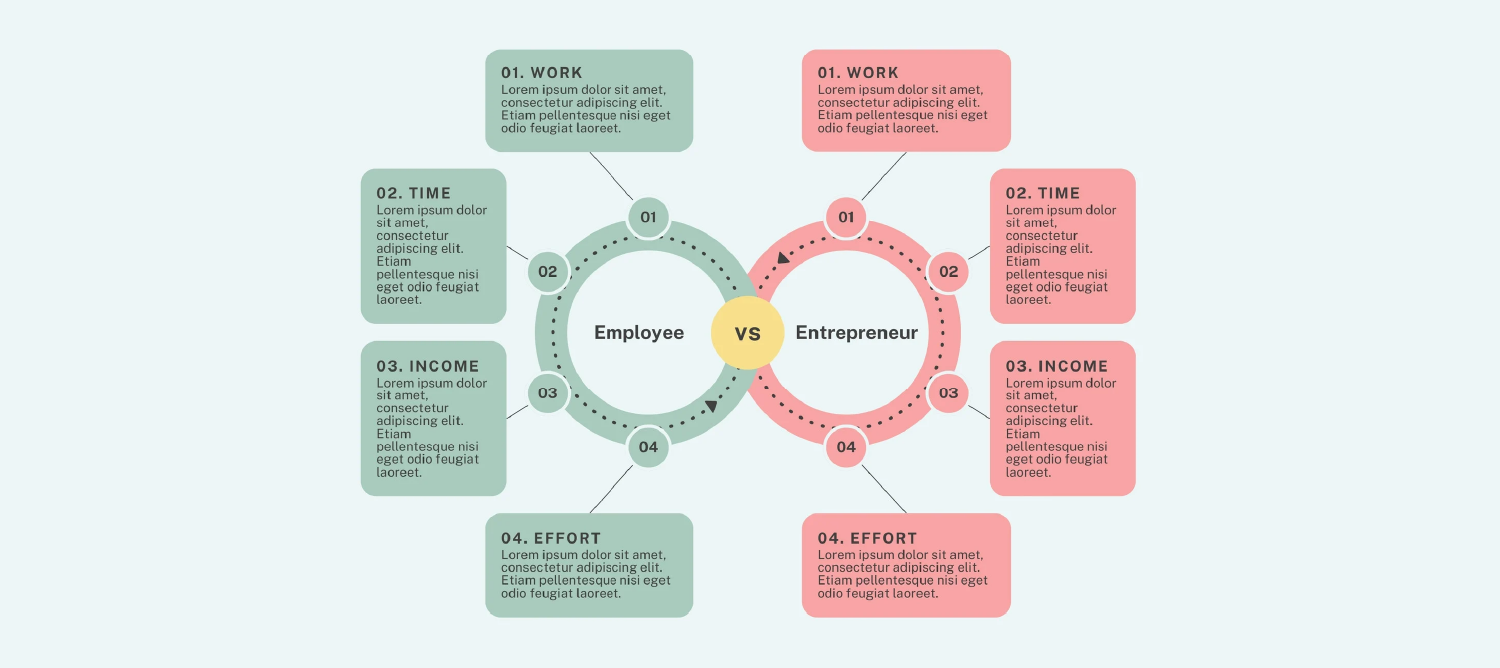
Highlight your product’s edge in style with a clean, side-by-side comparison. These infographic examples work wonders in sales pitches, demo decks, or pricing pages. Feature grids, checkmarks, visuals, and even testimonials can make your offer shine.
It’s one of the best infographic designs to help potential clients cut through the noise and say, “Yep, this is the one.”
Ideal for SaaS, B2B, and even e-commerce brands competing in crowded spaces.
4) Timeline Infographic (History/About Us)
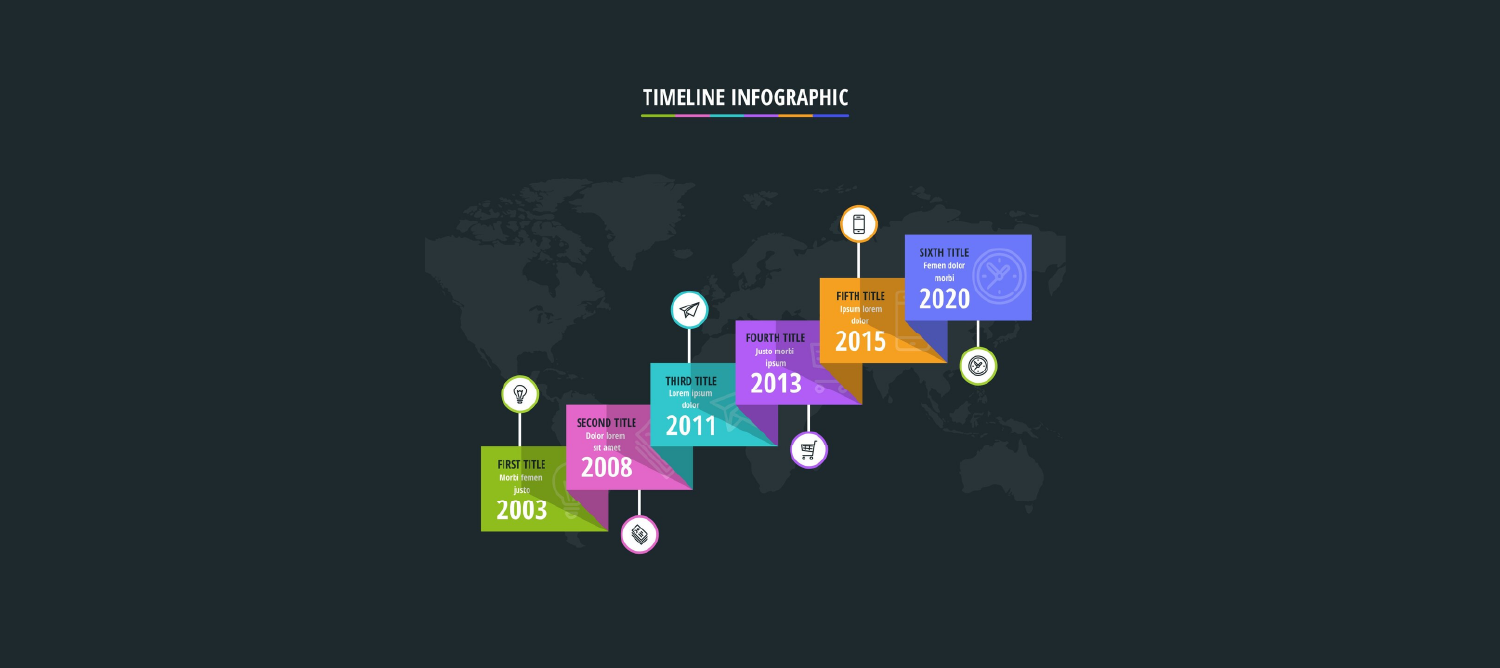
Want to show how far you’ve come—or where you’re going?
A timeline infographic lays it out beautifully. This infographic example shows key milestones, funding rounds, product launches, or even your founding story.
These infographic examples for business add context and credibility, especially on investor decks or “About Us” pages, through various design elements. With horizontal or vertical scrolls and a mix of icons and dates, it’s a visual narrative that says, “We didn’t just grow. We evolved.”
5) Statistical Infographic (Reports)
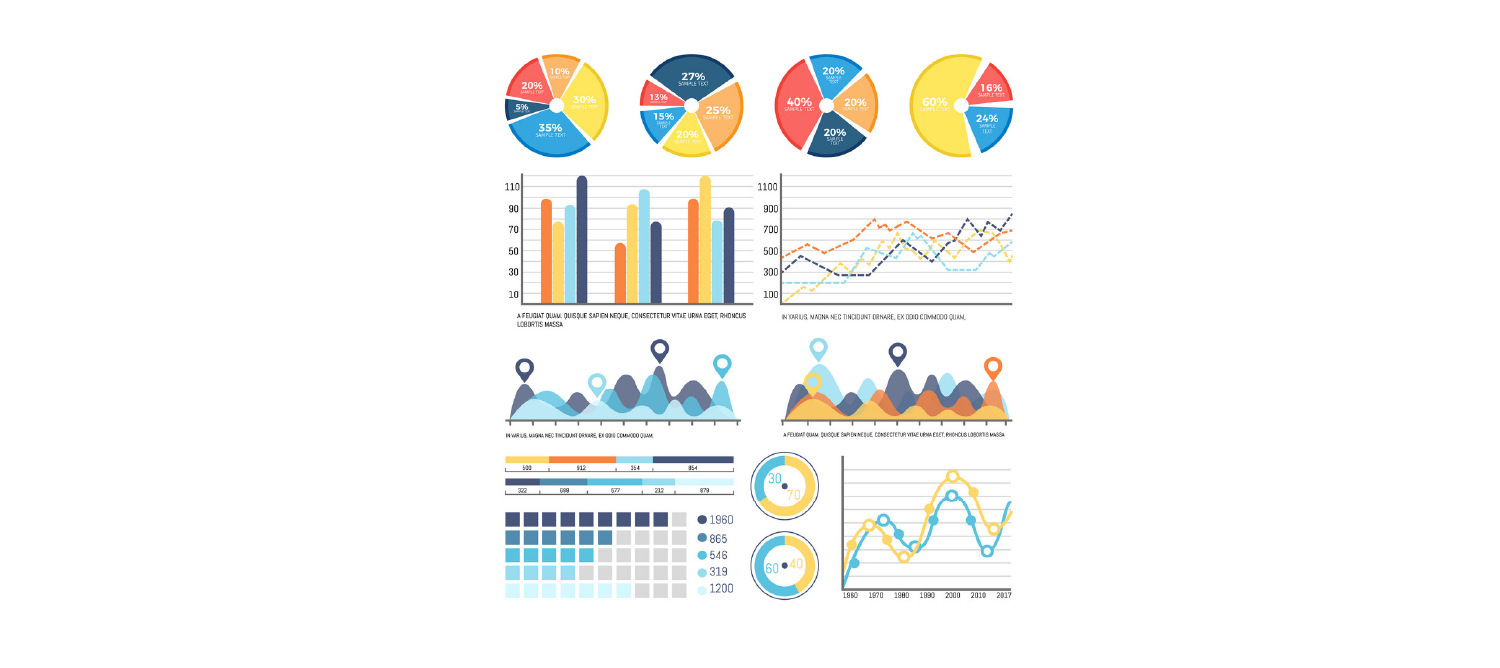
Data deserves better than a spreadsheet. Enter the statistical infographic—a game-changer for quarterly reports, research summaries, and data storytelling. Charts, graphs, percentages, and icon-based numbers bring life to metrics that matter. These infographic examples for business ensure your stakeholders not only see the data in charts and graphs but also understand it. It is one of the best infographic designs when you need to say, “Here’s the proof,” and actually get people to care.
6) Hierarchical Infographic (Strategy)
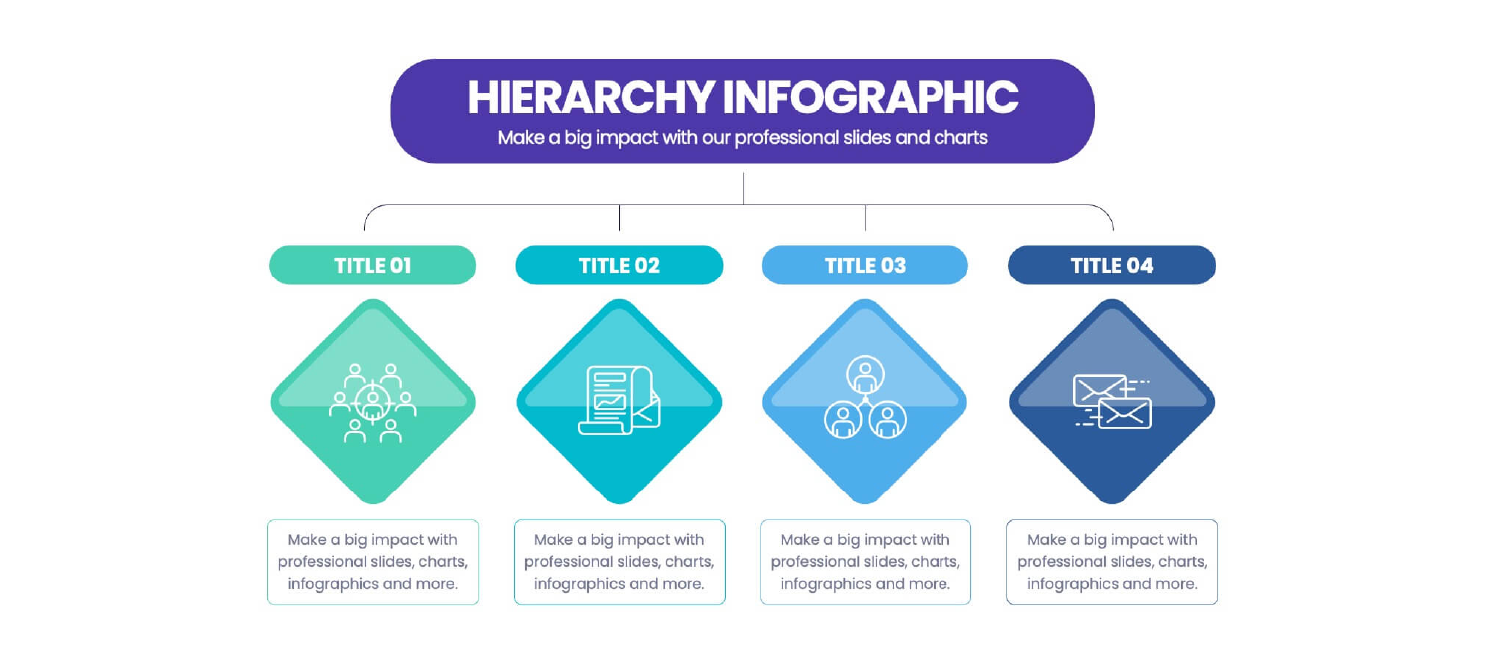
Need to show structure, power flows, or strategic frameworks?
This infographic example turns org charts, decision trees, and models into digestible layouts. It moves top-down (or inside-out), so everyone understands what matters most and how everything connects. Great for internal alignment, leadership presentations, and strategic planning docs. These infographic examples for business reduce friction and boost clarity—two things every decision-maker loves.
7) List Infographic (Tips & How-Tos)
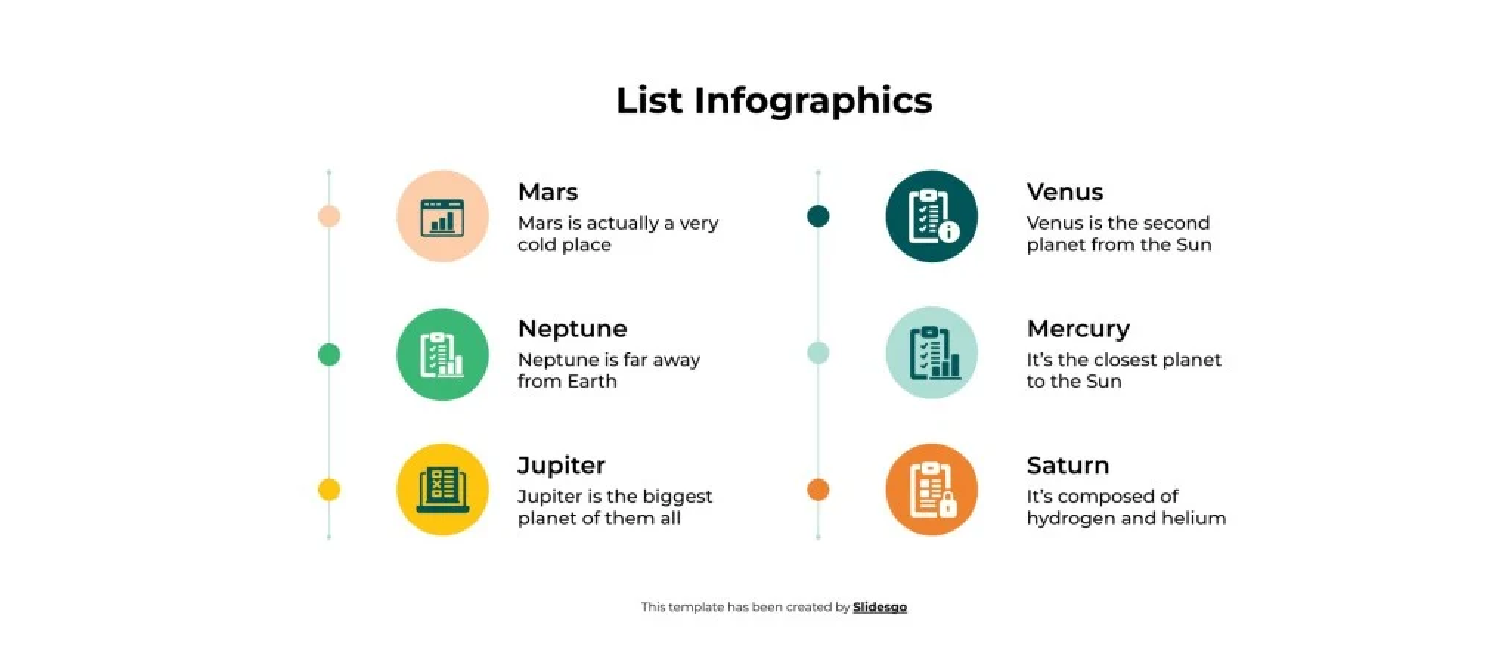
Quick tips? Best practices? Step-by-step guides?
List infographics are your BFF. They’re clean, easy to scan, and perfect for social media, blog headers, or training modules. These infographic examples use bold numbering, icons, and short copy chunks to break things down fast. Among the best infographic designs when you want high value in a scroll-friendly package. Audiences love them, and so does your CTR.
8) Interactive Infographic (UX/Website)
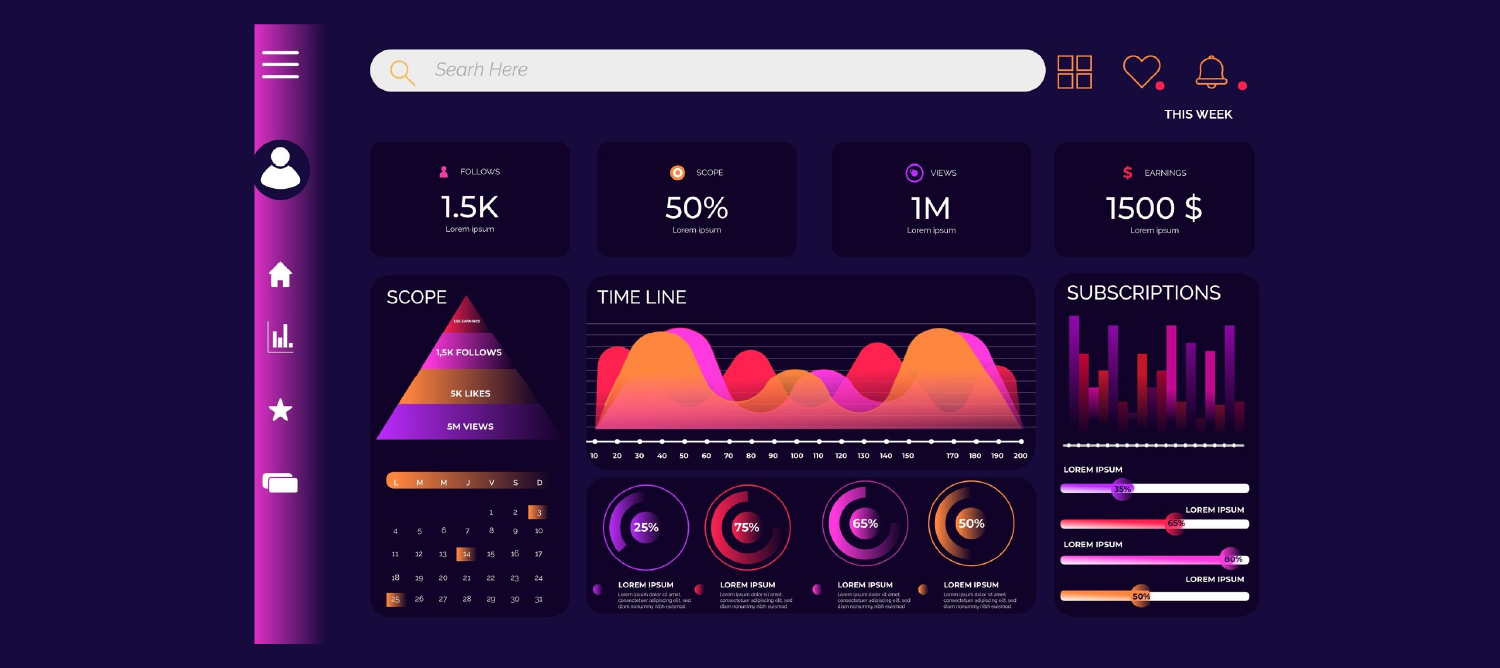
Why just look when you can explore?
These infographic examples bring data and content to life with clickable, scrollable, or animated elements, including an interactive map. Ideal for websites, reports, and microsites that want to wow users while educating them. Among the best infographic designs for UX, they combine tech, design, and storytelling into one seamless experience. These infographic examples for business not only look cool—they deepen engagement and improve time-on-site.
9) Social Media Infographic (Engagement)
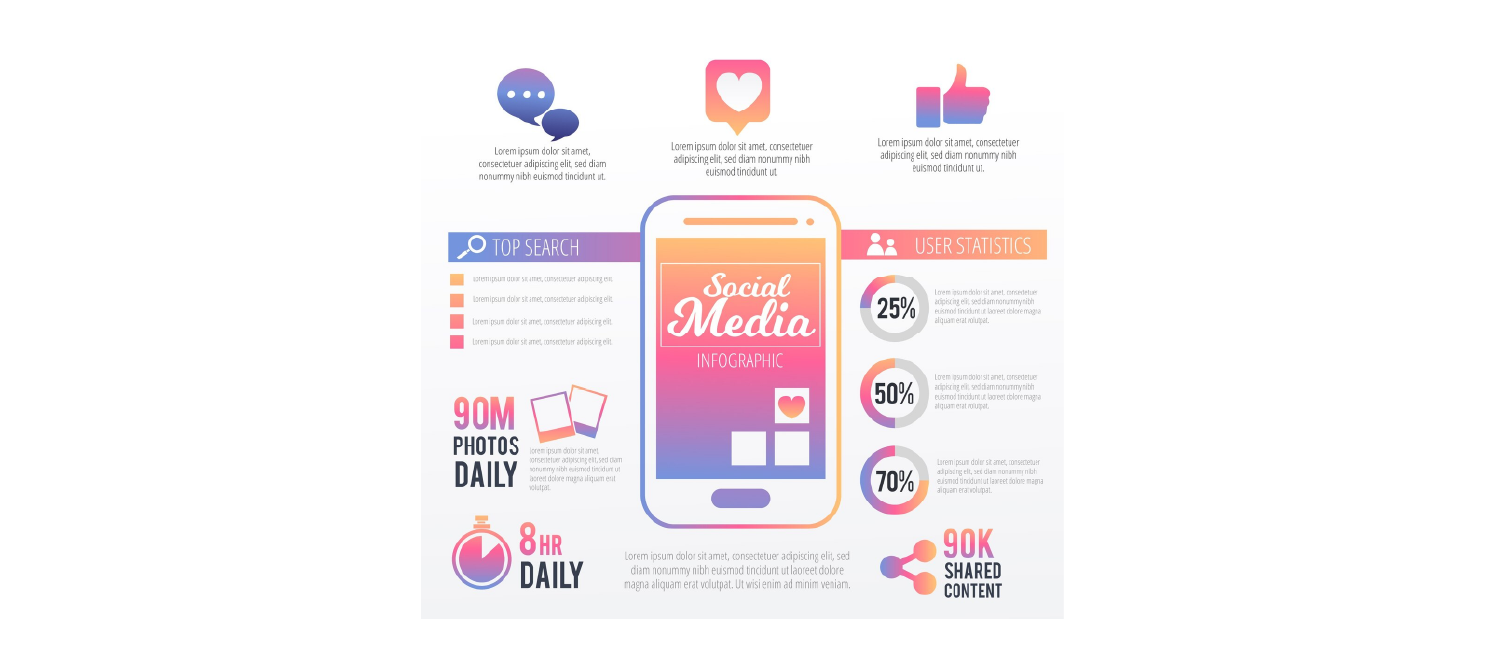
Attention spans are short. These infographic examples are designed to make an impact—fast. Great for Instagram carousels, LinkedIn posts, or story formats, they package insights, quotes, or tips in a way that drives shares and saves. These infographic examples for business are ideal for awareness campaigns, product launches, or trendspotting posts. Eye-catching, thumb-stopping, and brand-boosting—this is where social strategy meets sleek design.
10) Product Roadmap Infographic (PM/Tech)
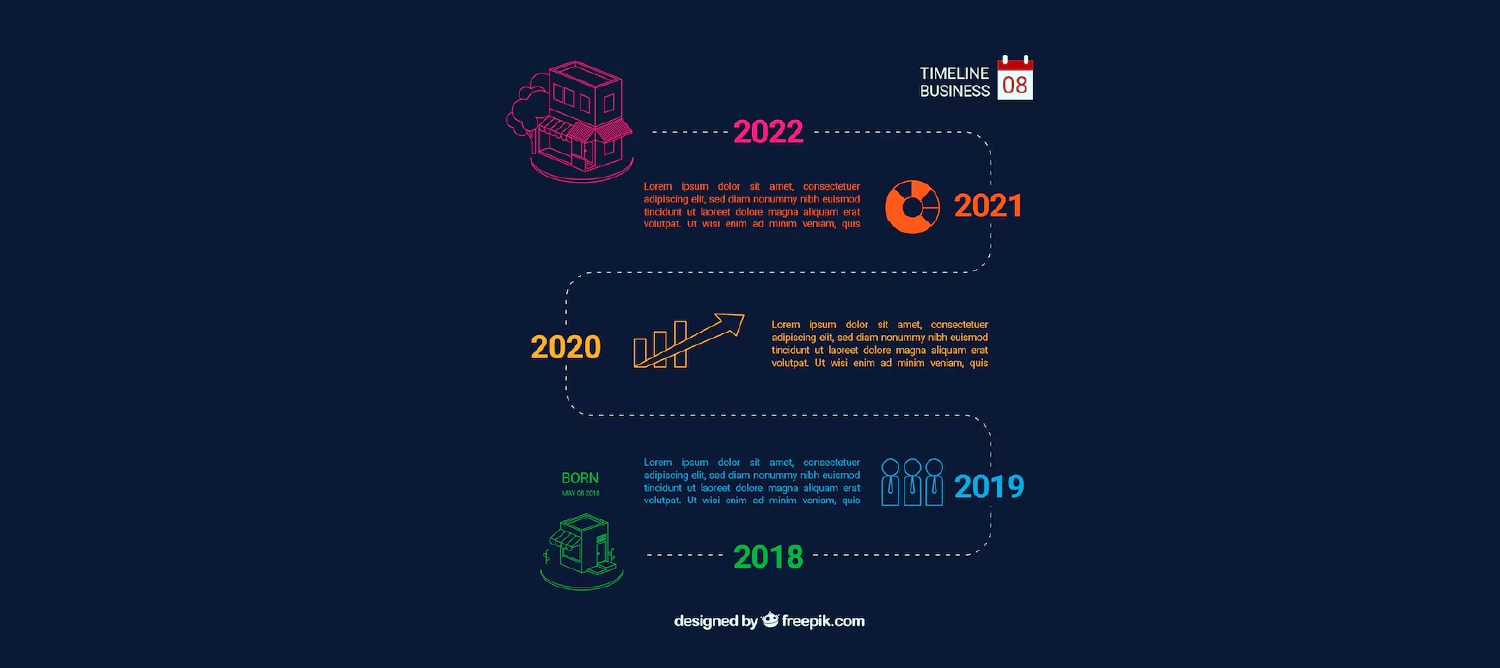
If you have got a vision and need your team—or investors—to see where you’re going, this is your go-to. These infographic examples for business lay out product features, launches, and milestones in a clean visual path. Great for SaaS, startups, or agile teams. It turns tech jargon into a journey everyone can follow, among the best infographic designs for aligning stakeholders and keeping development teams moving forward without the need for 12 different update meetings.
11) Case Study Infographic (Client Success)
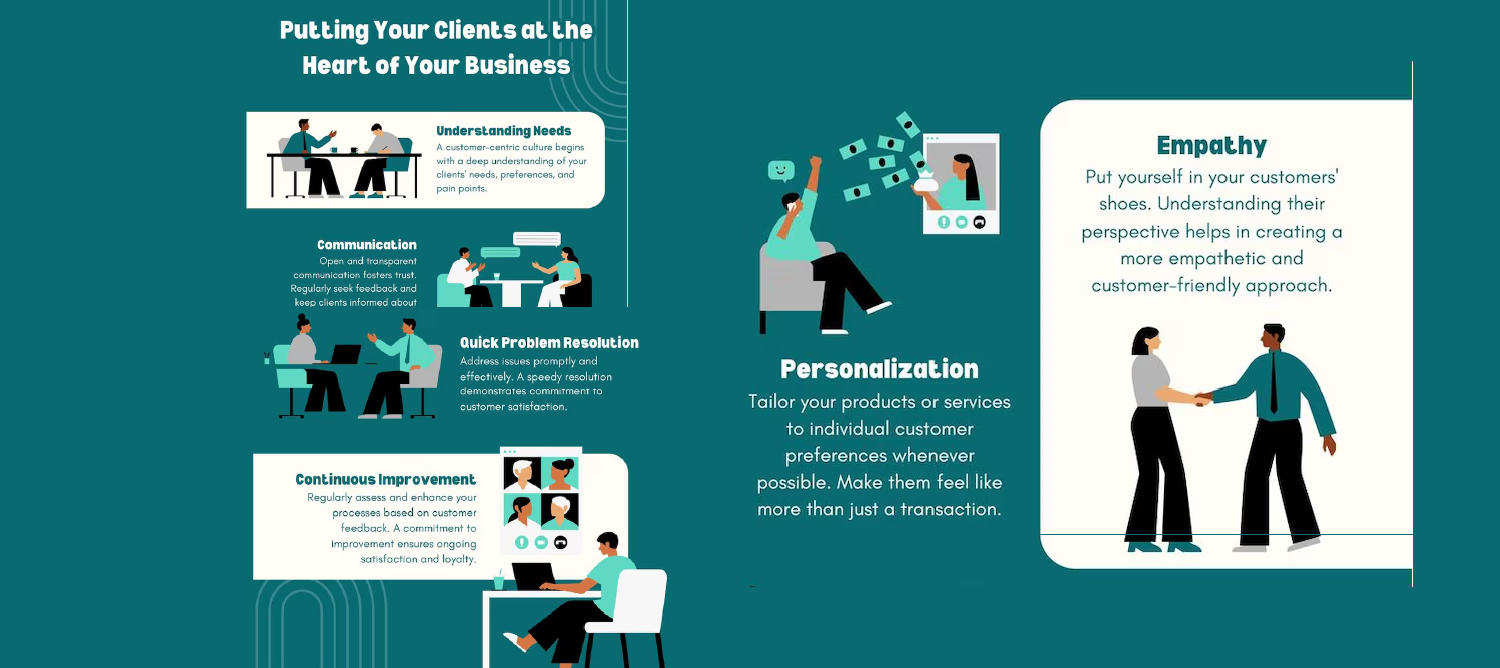
Why send a long PDF when you can show off your results visually? This infographic example compresses a client success story into digestible wins, metrics, and before/after snapshots without excess written content. It’s ideal for pitch decks, landing pages, and sales enablement. These infographic examples for business are storytelling powerhouses—turning complex projects into proof points that resonate and can be easily customized. Great for agencies, consultants, and service-based brands looking to let their work speak (beautifully) for itself.
12) Team/Org Chart Infographic (Internal)
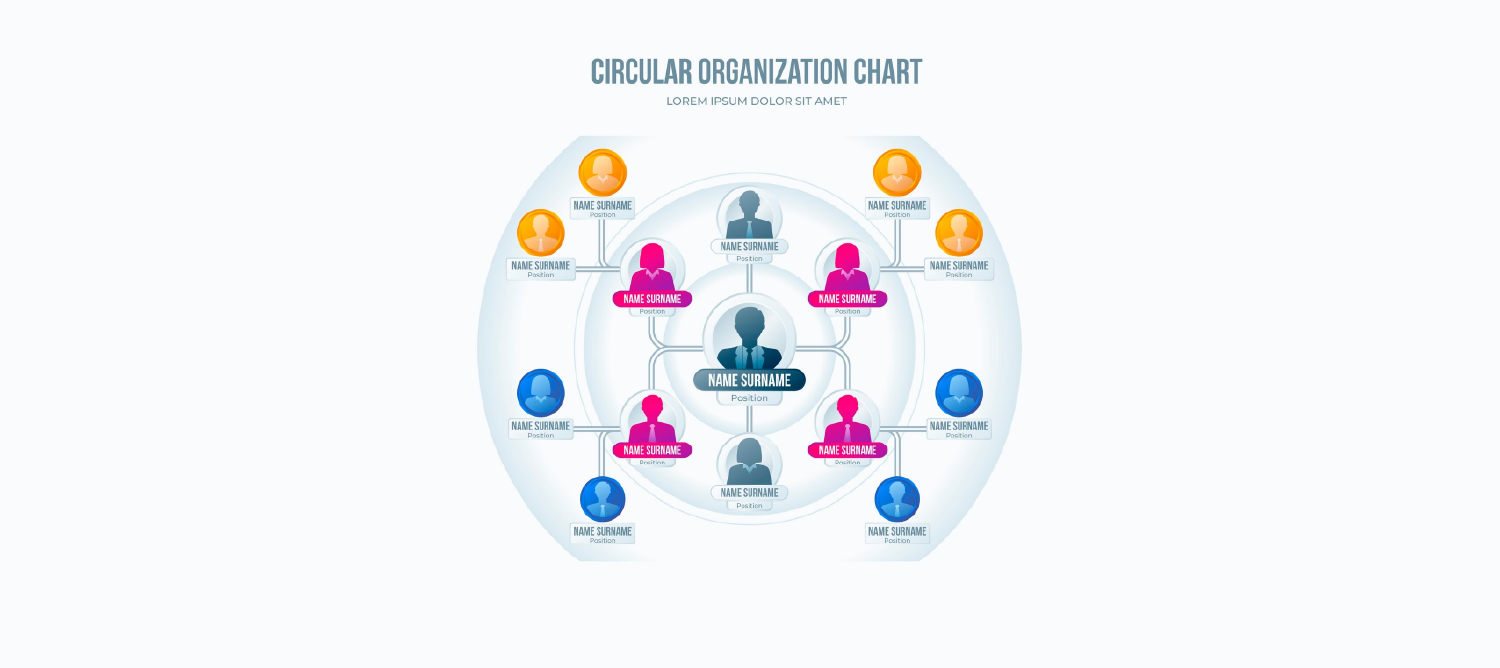
Hierarchy doesn’t have to be boring. A well-designed org chart can showcase your team structure, departments, or even cross-functional pods in an intuitive, visually appealing way. One of the best infographic designs for internal communication and onboarding. Whether you’re scaling fast or just keeping roles and reporting lines clear, this infographic example helps demystify the “who does what” question that clutters Slack threads daily.
13) Comparison Infographic for E-commerce (Product Listings)
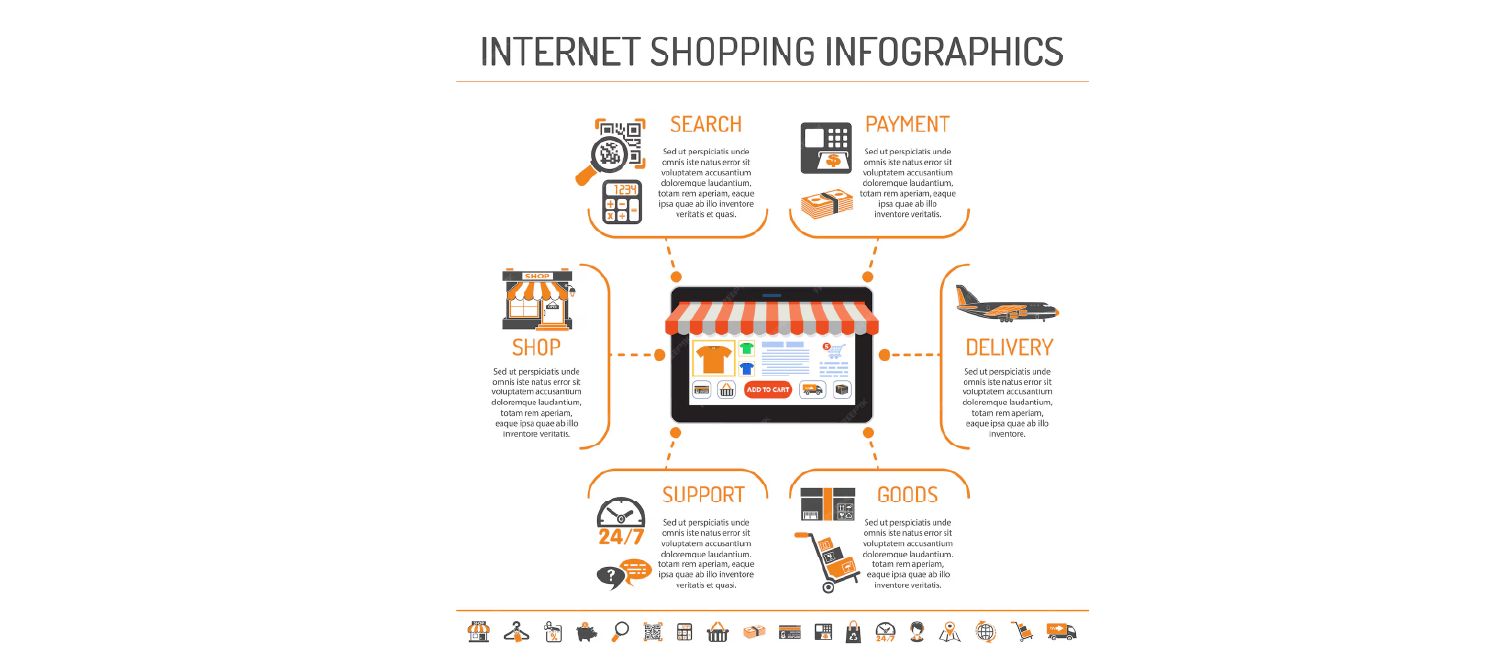
For e-commerce brands, this infographic example is gold. It lets shoppers quickly compare products, variants, or bundles side by side. Use icons, ratings, or feature checklists to reduce bounce rates and increase conversions. These infographic examples for business improve decision-making and reduce friction in the buying journey. A must-have for any high-SKU store looking to boost clarity without cluttering the interface.
14) Infographic for Market Research (Reports & Analytics)
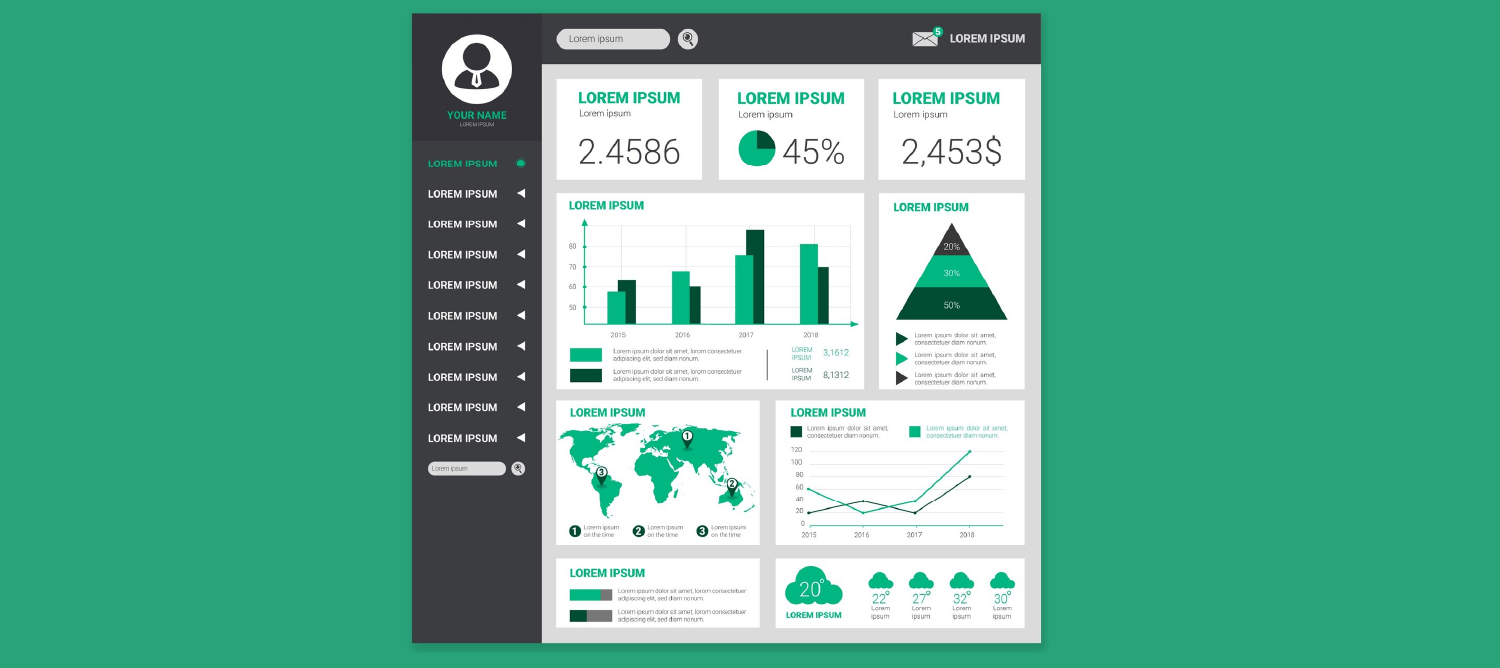
Turn your data dump into insight candy. This infographic example transforms raw market research into patterns and stories people actually want to read. Whether it’s demographics, trends, or behavior stats, visualizing it improves comprehension and recall. These infographic examples for business are essential for consultants, research firms, and internal analytics teams to communicate findings that spark strategy and action, not glazed eyes.
15) Event Promotion Infographic (Marketing)
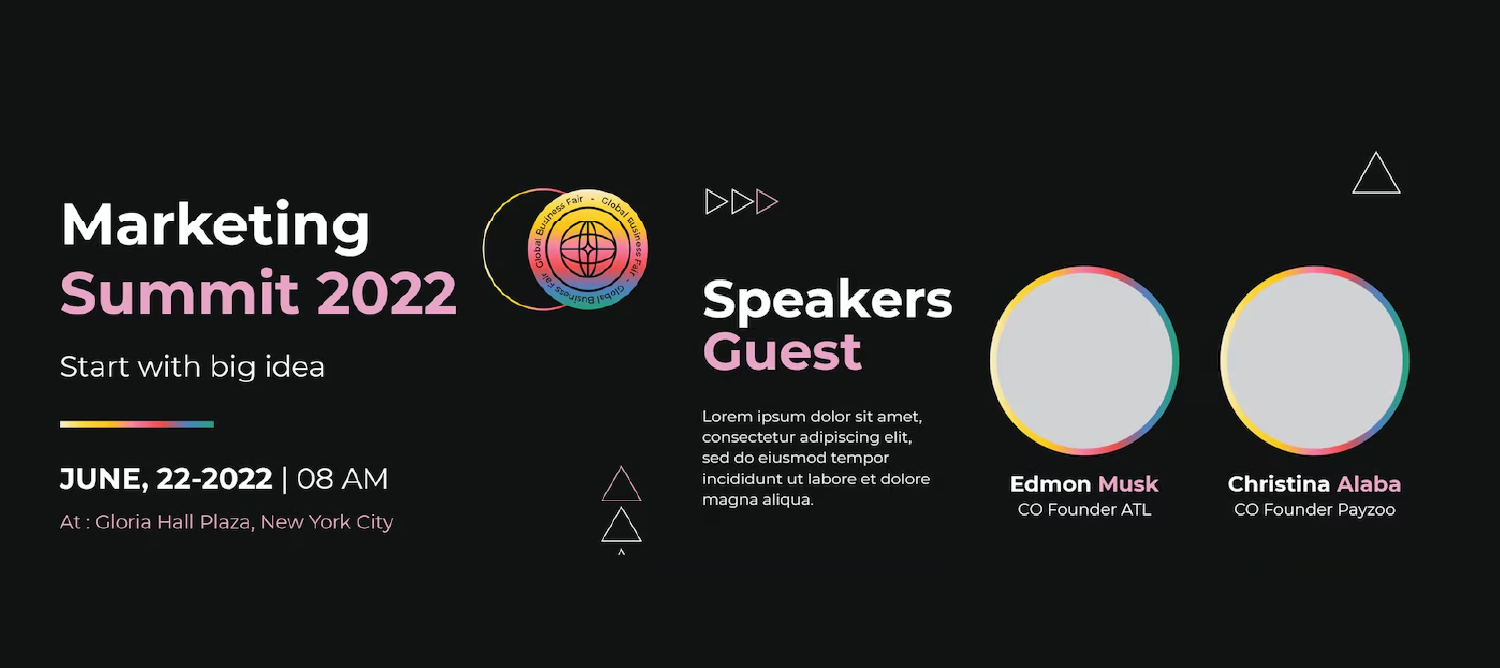
Launching a webinar, trade show, or conference? This is your secret sauce. Use it to promote the who, what, where, and why in a single shareable graphic. These infographic examples shine on social media, email invites, and landing pages. They’re not just pretty posters—they’re conversion tools. Among the best infographic designs for marketers looking to drive RSVPs and excitement with style and clarity.
16) Educational Infographic (Learning Materials)
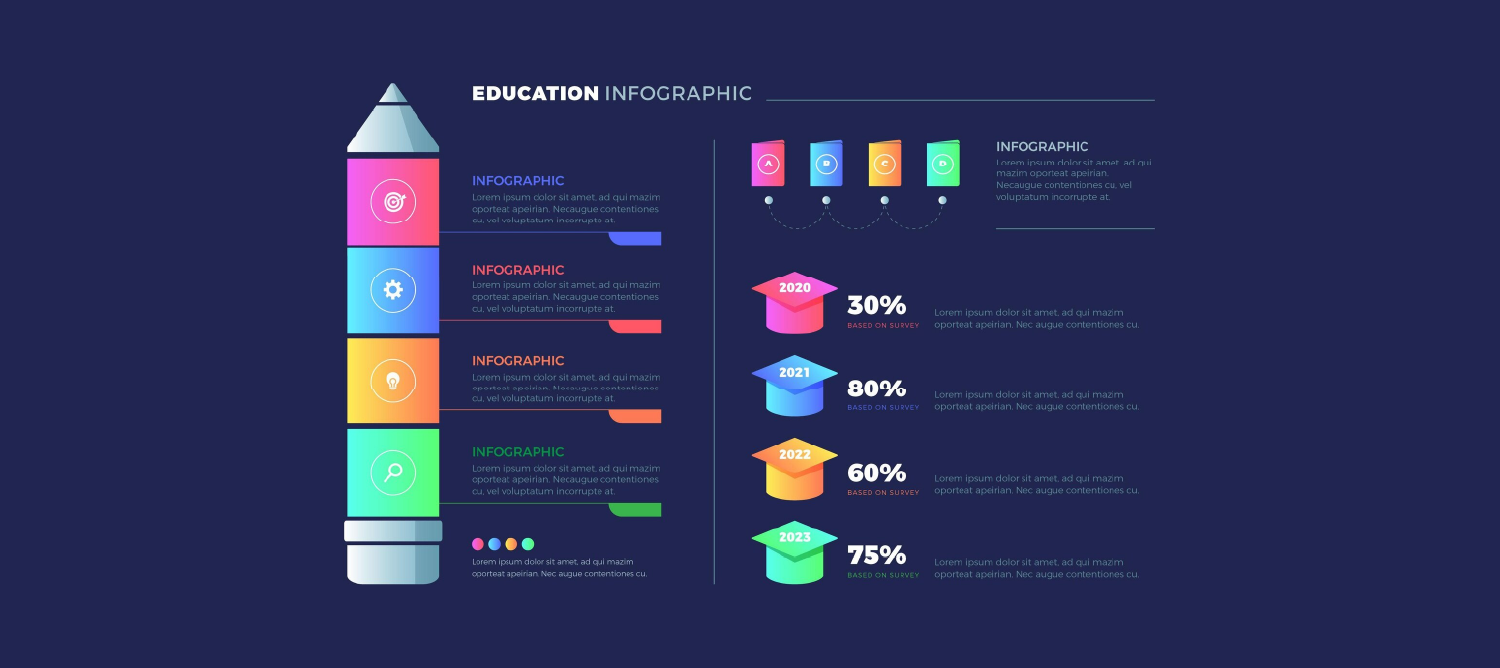
From biology basics to corporate compliance, educational infographic examples make learning a breeze with minimal text. Ideal for schools, e-learning platforms, or employee onboarding, these visuals simplify complex ideas with diagrams, analogies, and clean layouts. These infographic examples for business help boost engagement and retention. Add color-coded sections and icons to keep things scrollable and snackable. Truly among the best infographic designs when you want to turn “Huh?” into “Aha!” in under 60 seconds.
17) Data Visualization Infographic (Financial Data)
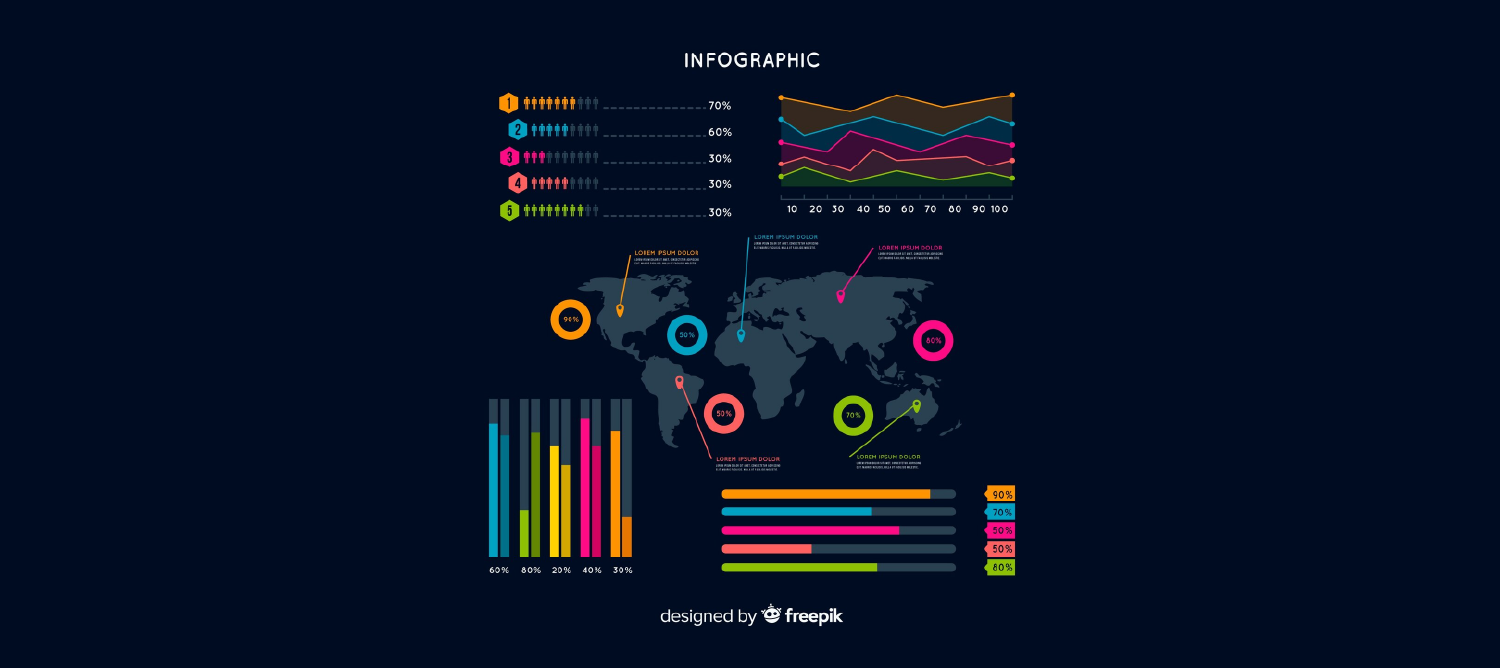
Nobody wants to stare at endless rows of numbers. But show those same numbers with graphs, bar charts, and icon-based stats?
Now we’re talking.
These infographic examples for business turn balance sheets and performance data into visually engaging storytelling, providing essential background for understanding finances. Perfect for CFO reports, investor decks, or financial blog posts. One of the best infographic designs for teams that need to customize and impress with clarity. Because when your numbers look good, you look even better.
18) Explainer Infographic (How It Works)
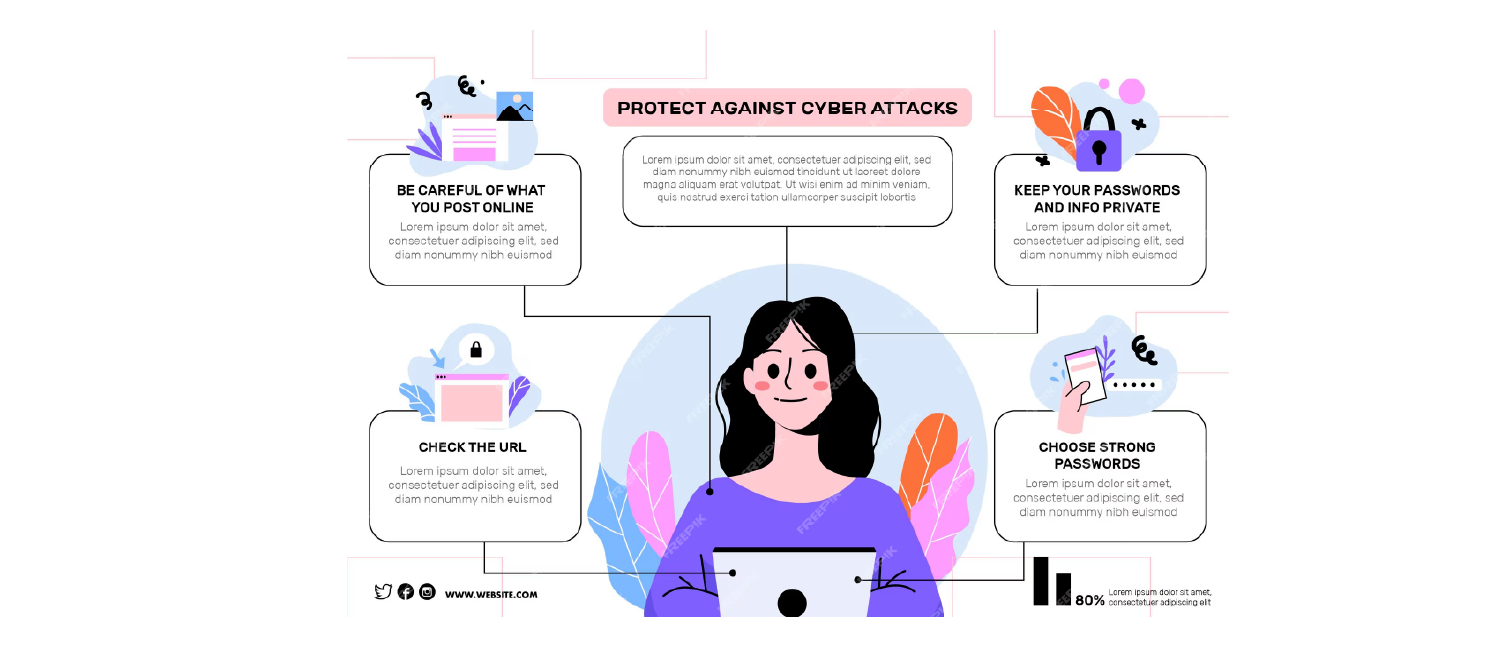
Have a product or service that needs more than just a tagline to explain? These infographic examples simplify the complex with visuals, concise text, and clever flows. Think of it like your elevator pitch—but in pixels. Great for SaaS products, onboarding flows, or new app features. These infographic examples for business are a go-to for “how it works” pages or sales collateral. One of the best infographic designs to get a resounding “Ohh, now I get it!”
19) Industry Trend Infographic (Research & Insights)
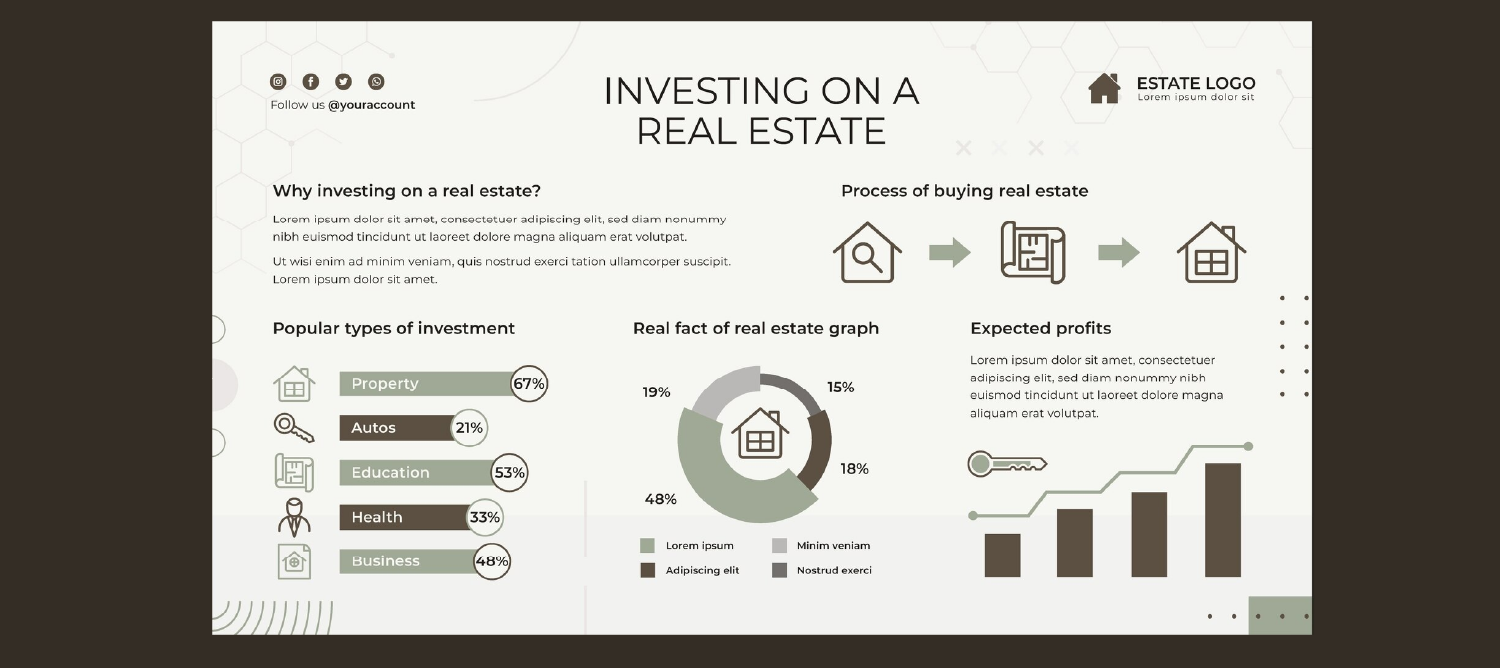
Be the voice of foresight. Use industry trend infographic examples to showcase key predictions, expert quotes, or emerging patterns. Whether you’re in tech, fashion, or fintech, these infographic examples for business help position your brand as a thought leader. Ideal for blog posts, LinkedIn carousels, or whitepapers, making it a great example of effective communication. These are the best infographic designs to generate shares, open conversations, and prove you’re not just in the game—you’re ahead of it.
20) SWOT Analysis Infographic (Business Strategy)
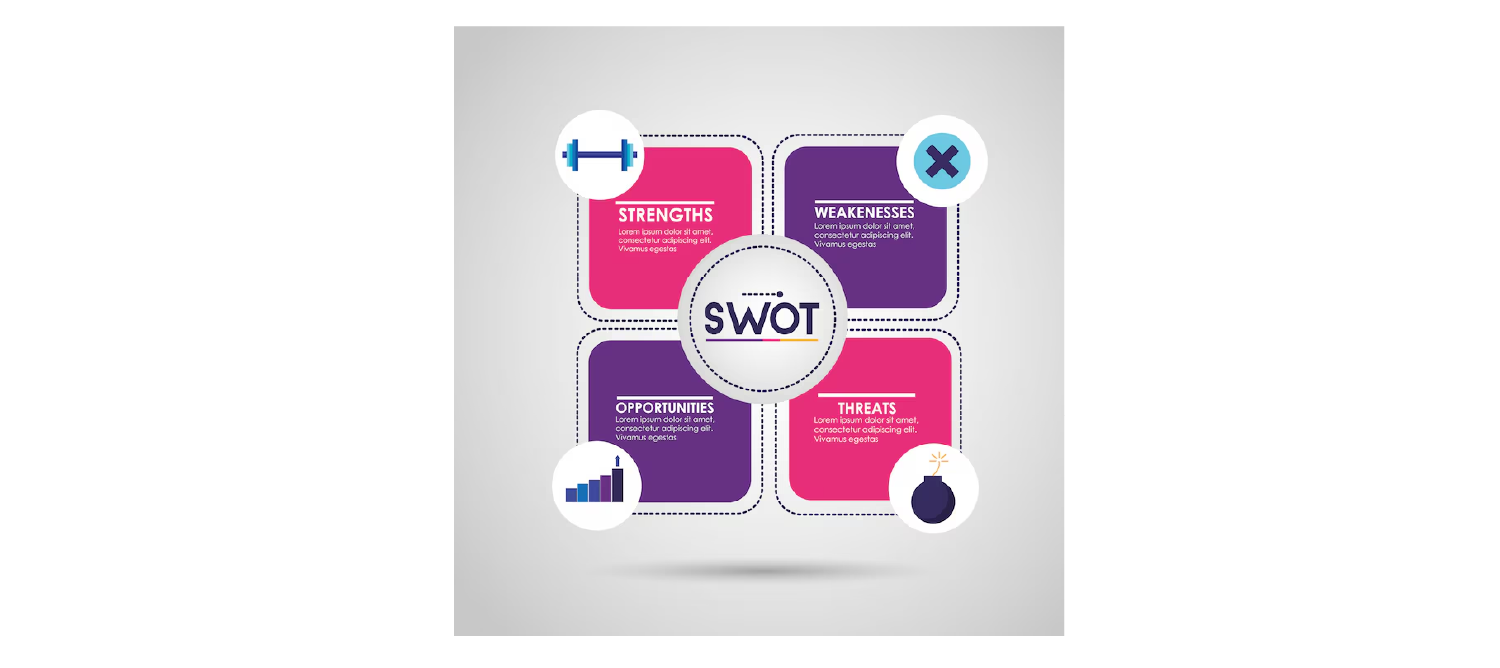
SWOTs don’t have to be boring spreadsheets. These infographic examples visually map out strengths, weaknesses, opportunities, and threats using quadrant layouts, icons, and bold colors, often inspired by template. Great for strategy meetings, investor decks, or quarterly reviews. These infographic examples for business distill complicated diagnostics into one polished, at-a-glance view. Among the best infographic designs is when you need to quickly show “what’s working” and “what needs work”—without losing anyone in the details.
21) Real Estate Infographic (Property Listings)
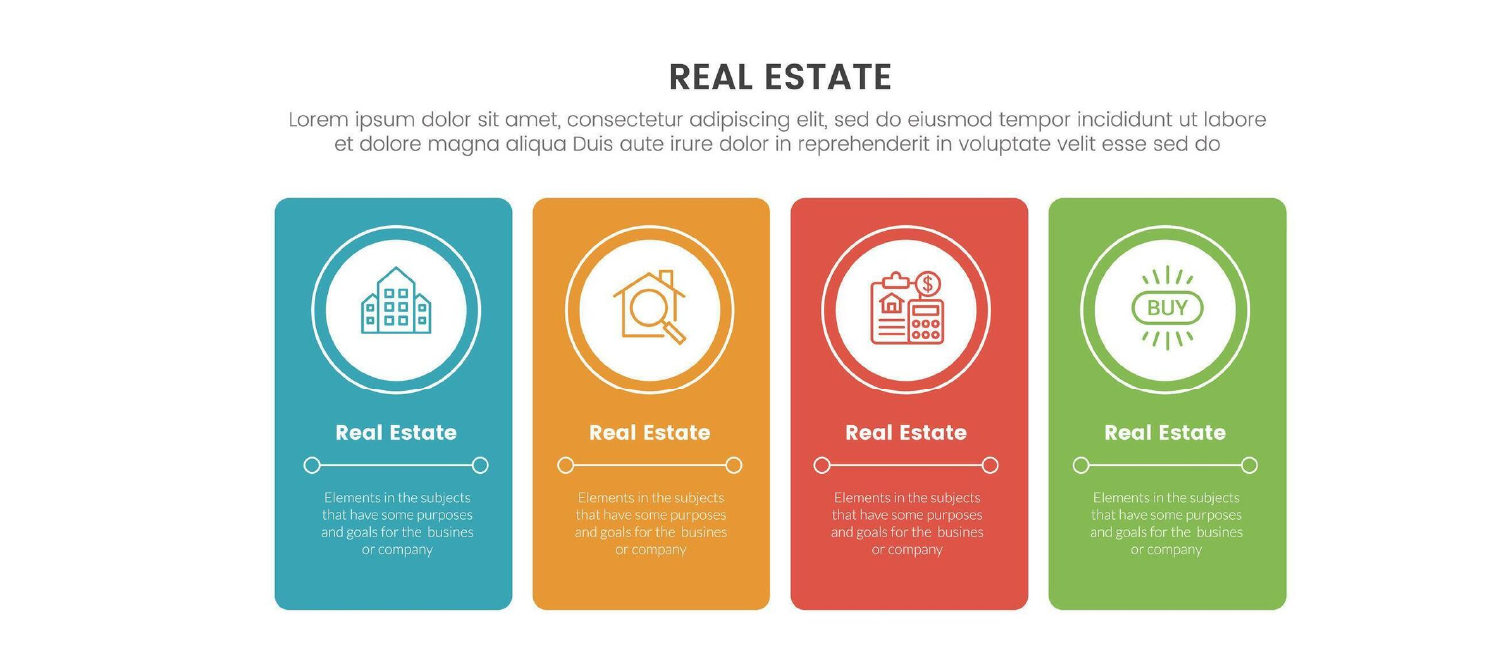
Selling a home? Leasing a commercial space?
These infographic examples let you showcase location, square footage, pricing, and amenities in one beautiful layout. A dream for agents and buyers alike. Use maps, checklists, and iconography to make listings pop. These infographic examples for business are great for brochures, websites, or social campaigns. One of the best infographic designs when you want to combine trust-building with easy comparison shopping in a snap.
22) E-commerce Sales Infographic (Product Performance)
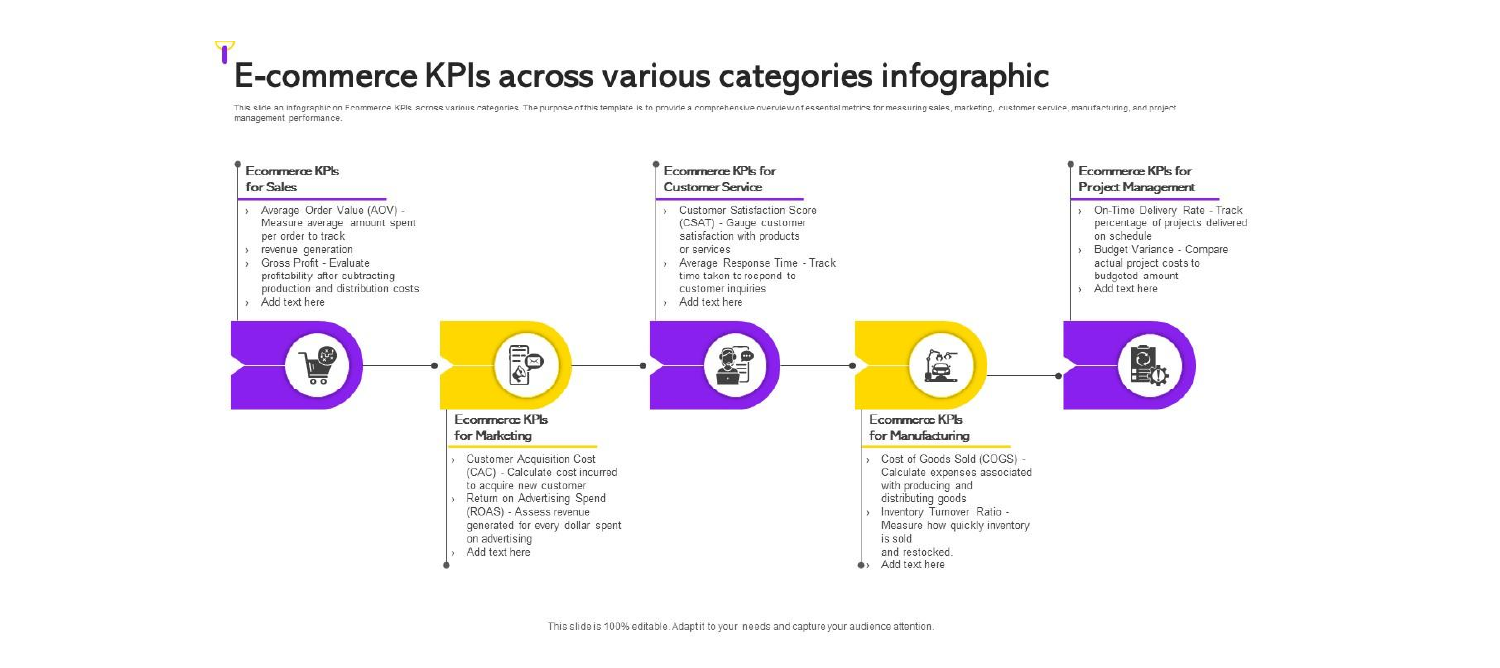
Product flying off the shelves?
Tell the world with numbers that shine. These infographic examples show off top performers, revenue spikes, customer ratings, and trends with fun visuals and engaging formats. Great for team dashboards, monthly reports, or investor updates. These infographic examples for business make data storytelling feel like a win. Truly among the best infographic designs to celebrate success—and motivate more of it.
23) Customer Feedback Infographic (Surveys)
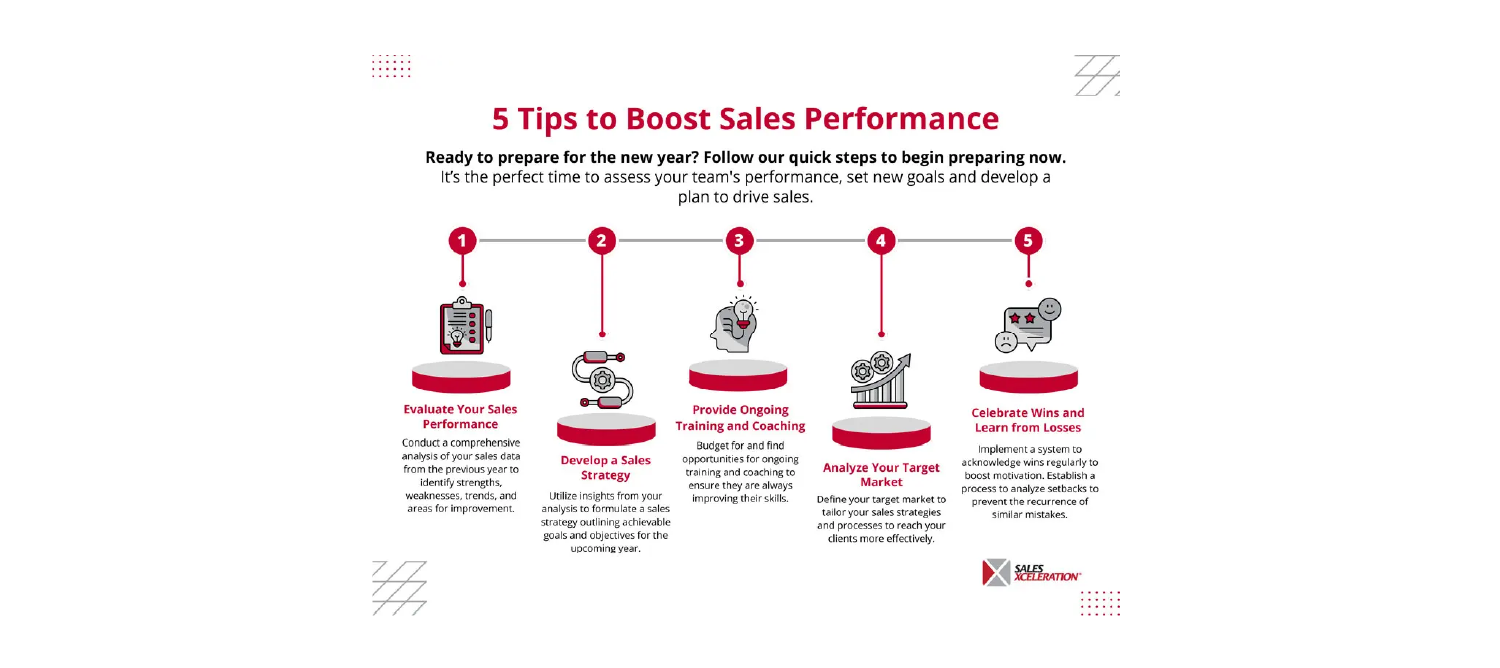
Gather tons of feedback? Don’t bury it in PDFs.
These infographic examples turn surveys, testimonials, and Net Promoter Scores into visuals that speak volumes. Use sentiment breakdowns, quote callouts, and stat bubbles. These infographic examples for business help CX teams, marketing, and product leaders stay aligned with customer needs. Among the best infographic designs for showing how people really feel—and what to do about it.
24) Infographic for Non-profits (Campaigns/Stats)
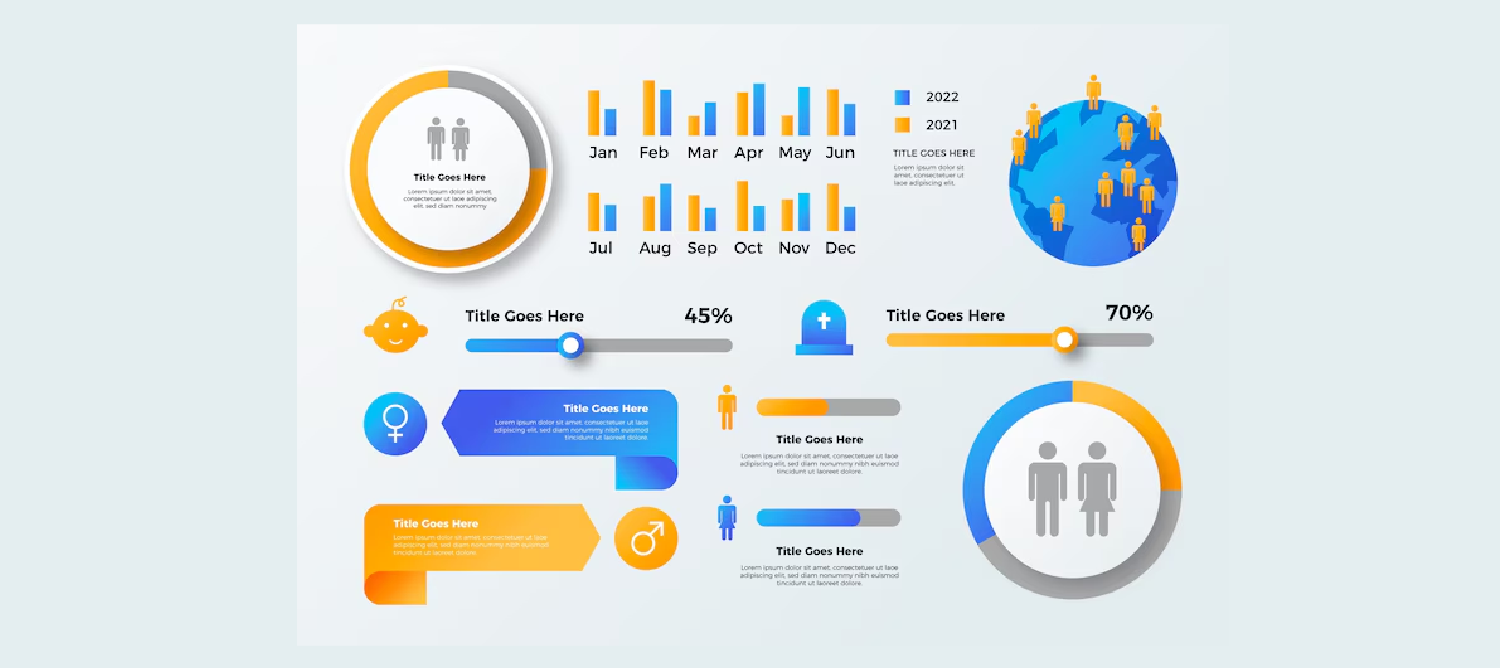
Impact needs visibility. These infographic examples are perfect for showing how many meals you served, trees you planted, or lives you’ve touched. Use storytelling + stats to move donors, volunteers, and partners. These infographic examples for business (and beyond) make transparency compelling. Add photos, progress bars, or emotive quotes for an extra punch. Among the best infographic designs when you want to turn compassion into action.
25) Healthcare Infographic (Medical Stats/Processes)
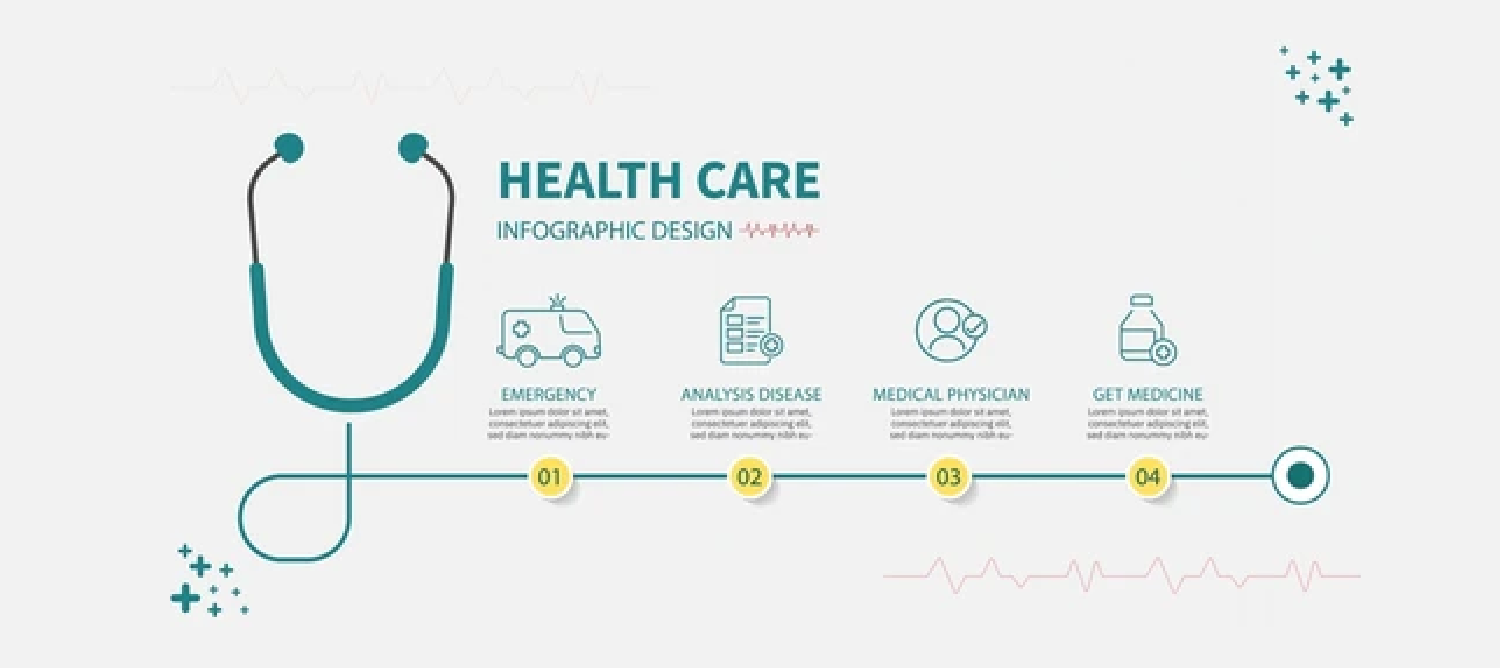
Medical data doesn’t have to be intimidating. These infographic examples simplify conditions, treatments, or research findings using clean visuals and a calming tone, often incorporating a brand logo. Ideal for hospitals, clinics, or pharmaceutical reports. These infographic examples for business (and care providers) build trust by making complex medical concepts easy to grasp. Add charts, icons, or anatomy diagrams to enhance clarity. Among the best infographic designs for boosting health literacy and patient engagement at every touchpoint.
26) Sustainability Infographic (Environmental Data)
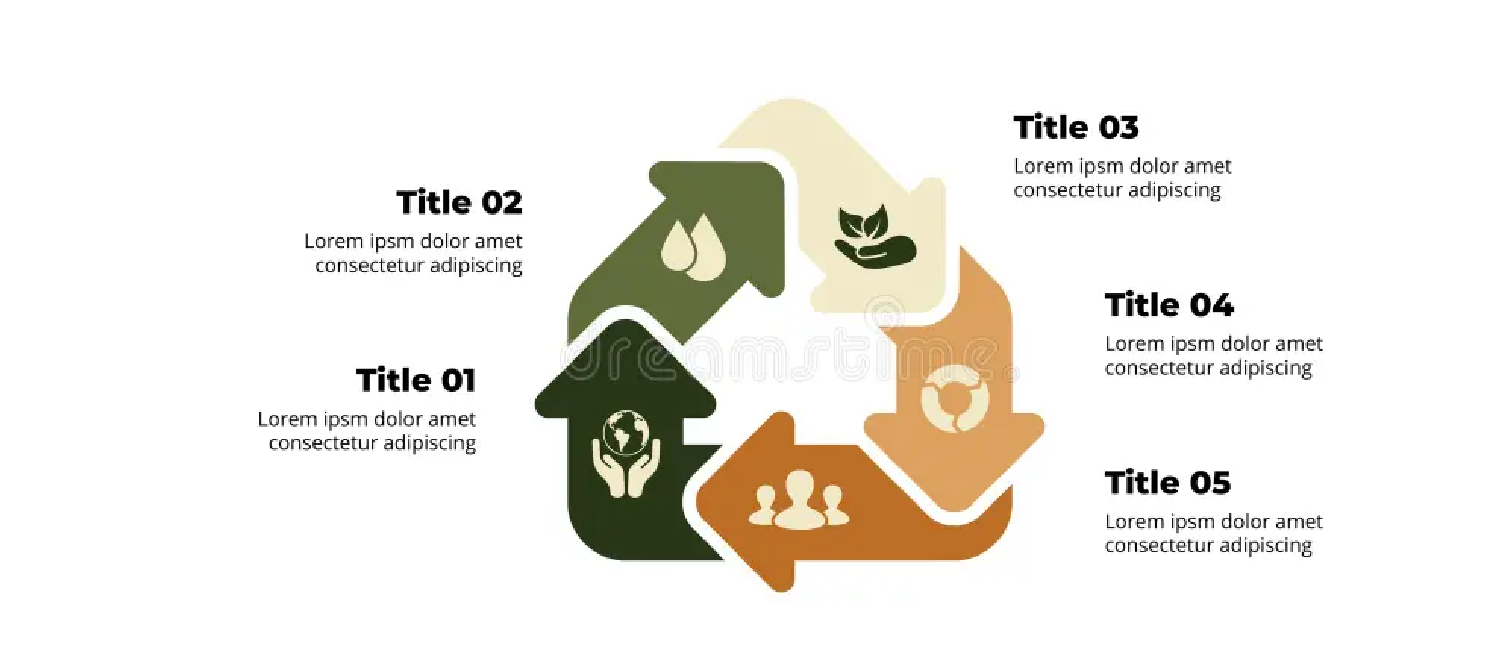
Want to show you care about the planet?
These infographic examples turn CO2 stats, recycling programs, or green energy initiatives into compelling visuals. Great for CSR reports, sustainability campaigns, or annual disclosures. These infographic examples for business help eco-conscious brands connect with responsible consumers. Use nature-themed icons and earthy colors to drive the message home. One of the best infographic designs for making climate impact data digestible and share-worthy.
27) Infographic for Mobile App Features (Tech)
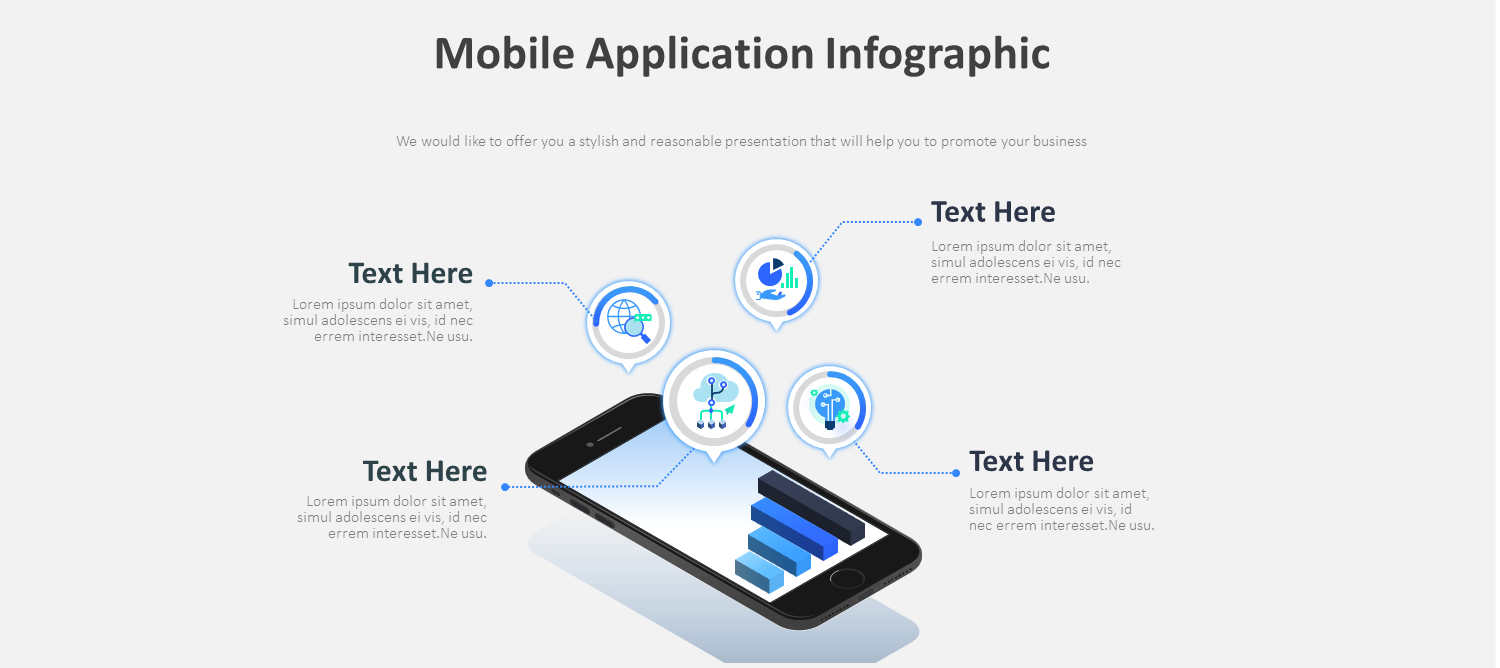
Show off your app like a pro. These infographic examples highlight top features, user journeys, or onboarding flows in a clean, swipeable format, enhanced with illustration. Ideal for product teams, landing pages, or App Store graphics. These infographic examples for business are a visual cheat sheet that helps users “get it” fast. Add screenshots, icons, and micro-interactions for extra appeal. Among the best infographic designs when you want to turn downloads into daily users.
28) Event Timeline Infographic (Event Planning)
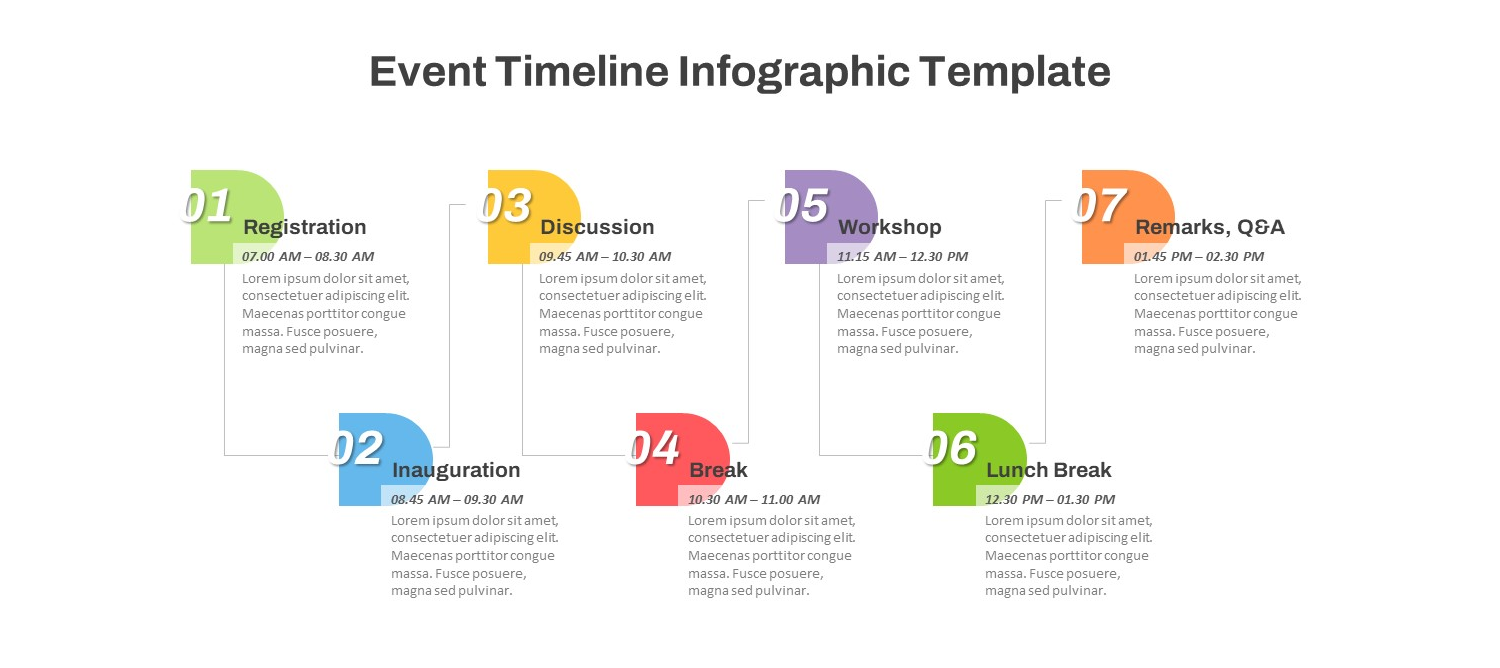
Who’s doing what, when, and where?
These infographic examples map out schedules, speakers, and key moments in one elegant visual. A must-have for weddings, conferences, or big launches. These infographic examples for business keep teams and guests aligned without a dozen follow-up emails. Use timelines, color-coded sections, or icon markers. It’s one of the best infographic designs for event pros who want to impress before the first guest even arrives.
29) Recipe Infographic (Food & Beverage)
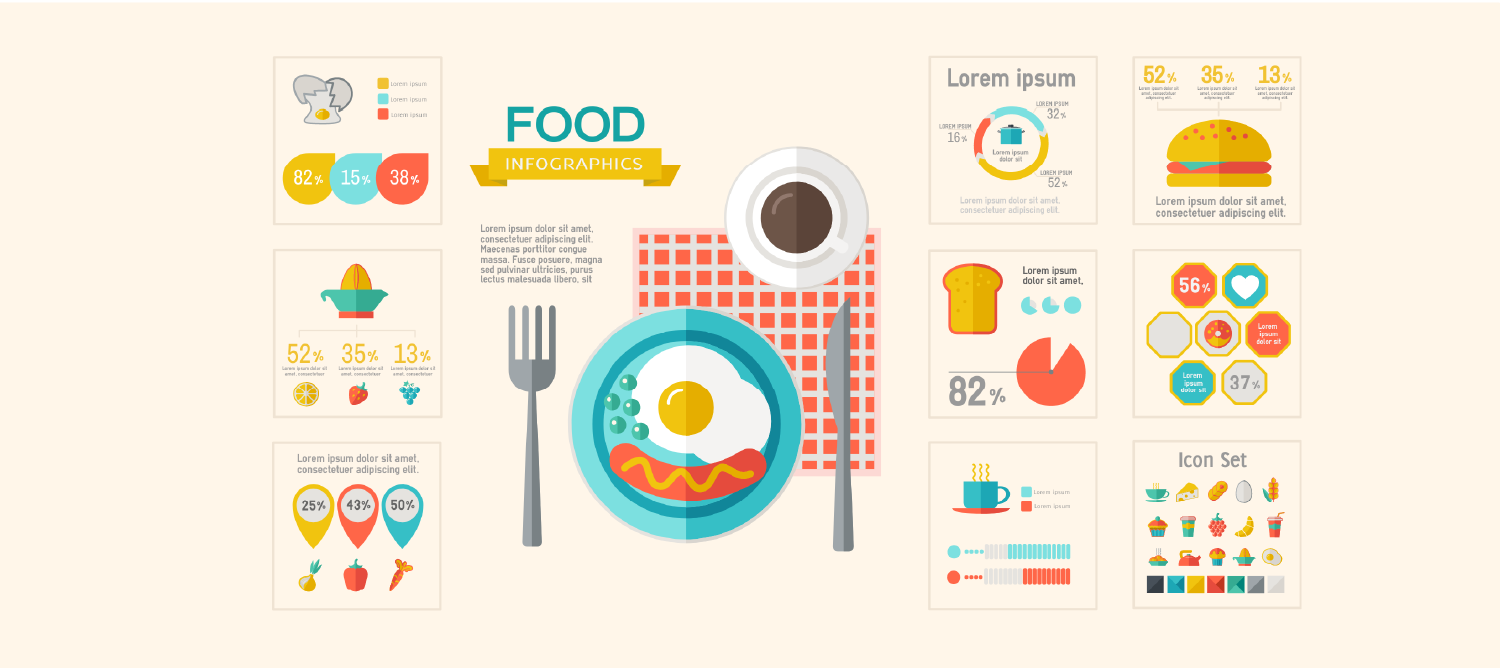
Food meets function. These infographic examples break down recipes with ingredients, steps, visuals, and even bar graphs in a format people love to save and share. Perfect for chefs, food bloggers, or FMCG brands. These infographic examples for business spice up cookbooks, packaging, or digital campaigns. Use photos, icons, and measurements in an easy-to-follow vertical layout. One of the best infographic designs to make cooking feel approachable, creative, and crave-worthy.
30) Technology Infographic (Tech Trends)
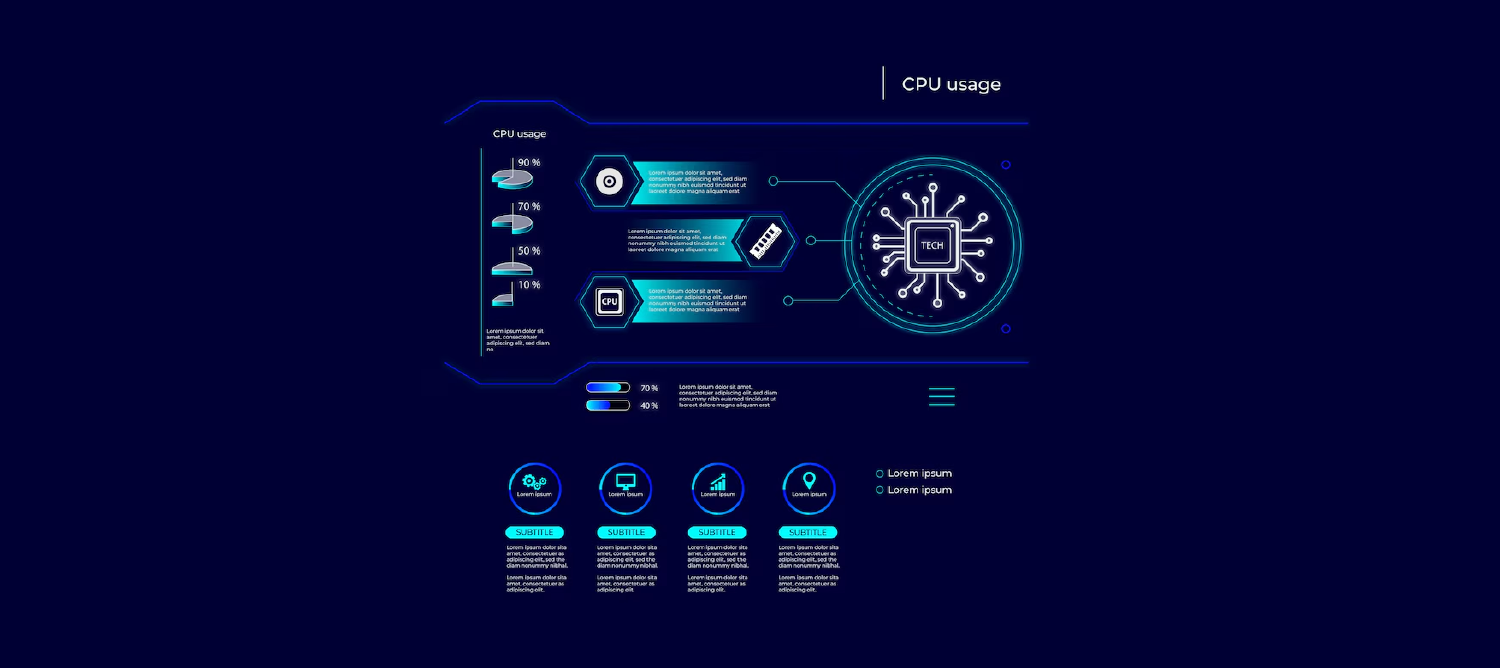
Explaining Web3, AI, or robotics?
These infographic examples use clean design, minimalist icons, and futuristic color palettes to simplify the next big thing. Great for tech blogs, startup decks, or IT training. These infographic examples for business translate jargon into visual clarity, helping audiences stay ahead of the curve. Add timelines, benefit highlights, or industry use cases. Undoubtedly one of the best infographic designs for making tech content trend-ready.
31) Workplace Safety Infographic (HR/Training)
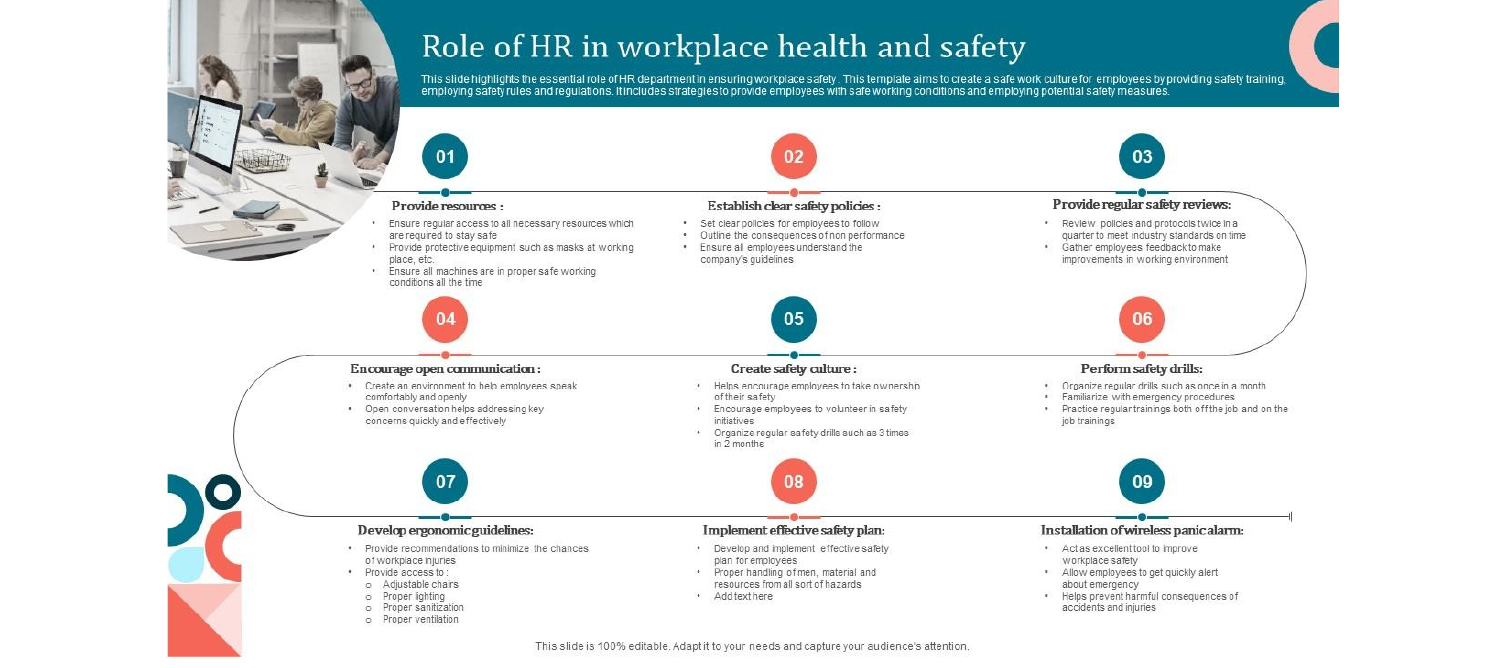
Safety rules aren’t effective if no one remembers them. These infographic examples bring clarity to safety protocols using symbols, flowcharts, and visual cues. Perfect for factories, labs, or offices. These infographic examples for business help HR and compliance teams reduce accidents and boost awareness. Add emergency contacts, do’s and don’ts, or PPE checklists. Easily one of the best infographic designs to create a culture of “see it, know it, follow it.”
32) Travel & Destination Infographic (Tourism)
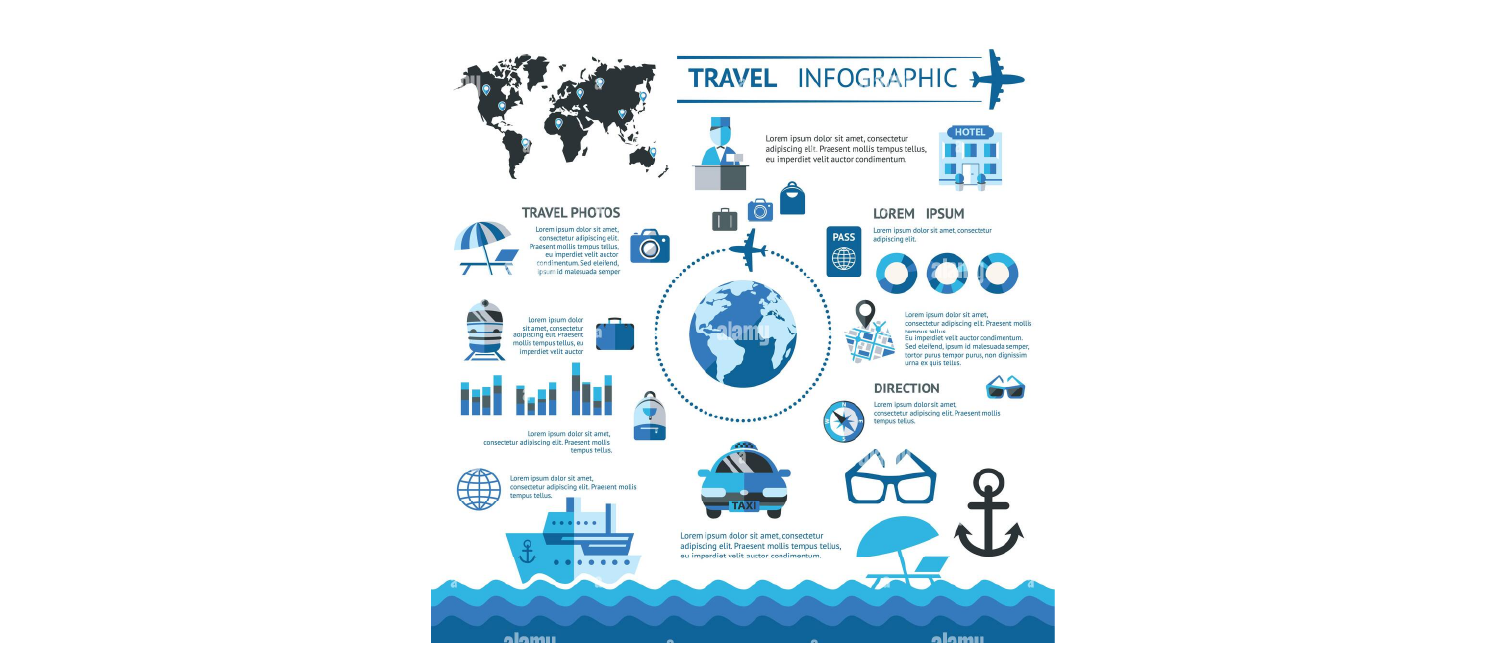
Wanderlust begins with visuals. These infographic examples map itineraries, show local highlights, and give packing tips in a postcard-worthy layout. Perfect for travel bloggers, tour operators, or airline campaigns. These infographic examples for business bring tourism marketing to life. Add maps, weather icons, and local phrases for extra flair. Definitely one of the best infographic designs for evoking excitement while providing helpful, saveable trip info.
33) Fitness Infographic (Wellness)
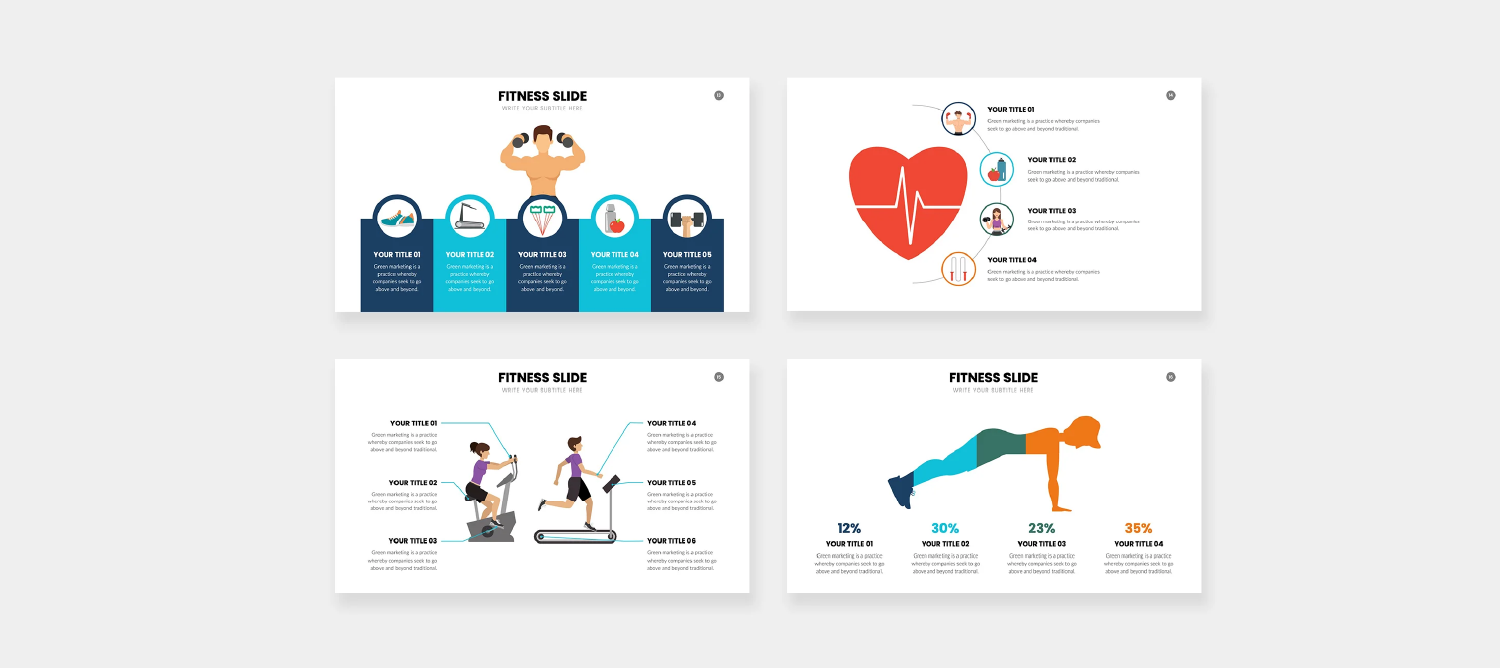
Turn workout plans into visual motivation. These infographic examples help trainers, gyms, and wellness brands share routines, macro guides, and hydration tips with flair, utilizing text boxes for clarity. Great for Instagram, websites, or gym posters. These infographic examples for business make health goals feel more achievable with friendly layouts and bold illustrations. From HIIT to holistic health, this is one of the best infographic designs with two columns to inspire, inform, and energize your audience.
34) Brand Story Infographic (Corporate Identity)
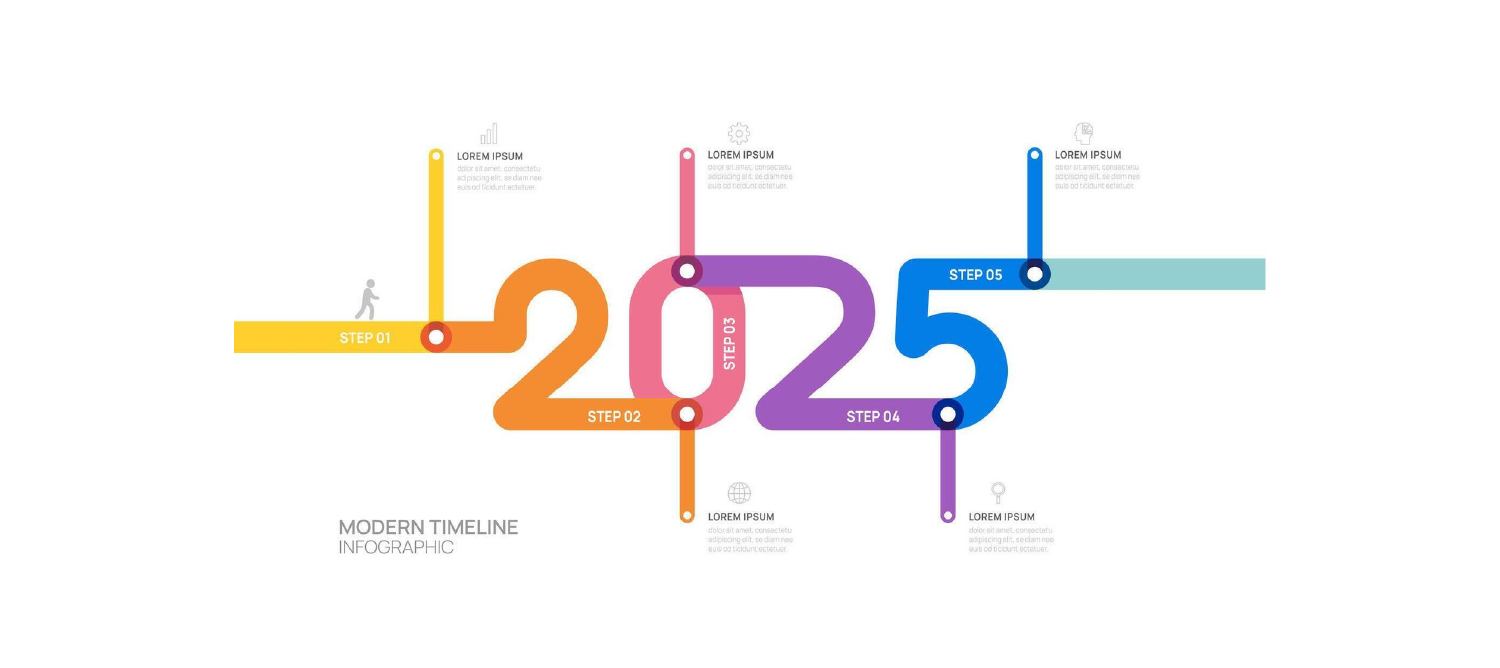
Your brand is more than a logo. These infographic examples bring your story to life—mission, history, culture, and milestones—all in one scroll-worthy narrative. Ideal for pitch decks, about pages, or investor meetings. These infographic examples for business humanize your brand and build connections fast. Use timelines, founder quotes, and key moments along with the main colors. Among the best infographic designs to turn your journey into a compelling visual legacy.
Seen a style that fits your needs? Let’s bring it to life!
From e-commerce dashboards to annual reports, INKLUSIVE crafts tailored infographic examples for businesses that drive real results.
How to Design an Infographic That Actually Works
So, you’ve got a great idea. Maybe it’s survey data, maybe it’s a product walkthrough, maybe it’s your brand’s entire life story.
But now comes the real deal — how to design an infographic that actually gets clicks, shares, and “Whoa, this is cool!” reactions.
Spoiler alert: it’s not just about making things pretty.
Let’s break it down, INKLUSIVE style — where design meets storytelling and results aren’t optional.
1. Start With a Clear Message
Before you even touch a design tool, ask yourself: What’s the one idea I want people to remember?
This is the holy grail of how to design an infographic that works.
Are you trying to educate, persuade, or just entertain? Nail that down first.
INKLUSIVE always starts by defining a core message that everything else supports — from the headline to the last icon. Think of it as your infographic’s elevator pitch in visual form.
2. Use Consistent Icons, Fonts & Branding
Ah, yes, the magic of cohesion.
Random icons from three different styles? Nope.
Five fonts in one scroll? Double nope.
How to design an infographic the right way means using consistent visual language — same stroke widths, font families, and color palettes that echo your brand identity. At INKLUSIVE, every element is handpicked to feel like an extension of your brand, not a patchwork quilt of Pinterest finds.
3. Design Hierarchy: What Matters Most
People scan before they read.
So if your most important stat is hiding in the corner while a minor subpoint gets headline treatment… we’ve got a problem.
How to design an infographic that leads the eye means using size, weight, and spacing strategically. INKLUSIVE’s designers obsess over what grabs attention first, second, and third — so your message unfolds naturally, just like a good story.
4. Don’t Just Inform. Tell a Story.
You’re not dumping data — you’re guiding someone through a journey. A good infographic is a narrative, not a spreadsheet. Think intro, climax, resolution. Maybe it’s a timeline of your startup. Maybe it’s a “before and after” of customer results. Either way, how to design an infographic that sticks is to craft it like a story with emotional beats, not just bullet points. At INKLUSIVE, we turn raw info into visual narratives that people feel and remember.
Want yours to not only inform but also inspire? Hit up INKLUSIVE — where strategy, design, and storytelling collide to create the best infographic designs out there.
Infographic Best Practices Every Brand Should Know
1. Infographic Best Practices We Swear By at INKLUSIVE
Want infographics that actually do something — like get shared, remembered, or even bookmarked (gasp!)? Then it’s time to ditch design chaos and lean into these infographic best practices we’ve refined at INKLUSIVE. We don’t just make pretty visuals. We create strategic, scalable content that talks, walks, and sometimes even sells.
2. Keep It Simple, Visual, and Actionable
Complex doesn’t mean better. The best infographics are easy on the brain and big on impact. Focus on one idea, use clean visuals, and include a clear CTA (what do you want people to do after?). That’s the holy trinity of infographic best practices. INKLUSIVE swears by it, every time.
3. Use Data Ethically and Accurately
Data is powerful — but only when it’s honest. Always cite sources, avoid misleading graphs (you know the ones), and use storytelling to support the truth, not twist it. At INKLUSIVE, every stat in our infographics is vetted, sourced, and woven into a bigger narrative with integrity.
4. Don’t Overcrowd: Embrace White Space
Think of white space as breathing room for the brain. Cramped layouts = confused readers. The best infographic designs leave room for the message to shine. It’s minimalism, but it makes it purposeful. INKLUSIVE’s layouts are airy, scannable, and designed for those precious 8-second attention spans.
5. Mobile-Friendly Layouts = Must
Scroll-happy audiences need vertical, responsive infographics that look just as good on a phone as on a desktop. It’s one of the golden infographic best practices in 2026. INKLUSIVE designs everything mobile-first — because if it doesn’t work on your screen, it doesn’t work. Period.
Infographic Design Trends to Watch in 2026
This year, infographics are getting sassier, smarter, and seriously more immersive. If you want to stay ahead of the curve, these infographic design trends 2026 are must-knows — and yes, INKLUSIVE is already doing them like a boss.
1. Motion & Interactive Infographics
Static is so last season. Motion graphics and interactive elements are transforming the way we scroll. Hover, tap, animate — users don’t just read, they engage. INKLUSIVE uses motion to guide stories, spark curiosity, and boost scroll time by up to 3x.
2. AI-Generated Visuals
AI is not replacing designers — it’s powering them. From data visualization to custom illustrations, AI speeds up creative cycles and adds fresh flavors to visuals. One of the coolest infographic design trends 2026, and INKLUSIVE is already blending AI smarts with human storytelling.
3. Brutalist Typography & Bold Colors
Forget soft pastels and overused sans serifs. This year’s infographics are leaning into raw, gritty fonts and unapologetic color clashes. Think bold, rebellious, and wildly scroll-stopping. INKLUSIVE uses these aesthetics to create thumb-stopping visuals, especially for younger, design-savvy audiences.
4. 3D Graphs & Isometric Styles
Want to turn heads in reports or tech decks? 3D graphs and isometric visuals create depth, clarity, and a sense of innovation. It’s like your data got a glow-up. INKLUSIVE uses this trend to add that “wow” moment, especially in investor decks or SaaS visuals.
5. Personalized Infographics Based on User Data
Infographics that talk directly to you? Yes, please. Brands are using user data to generate custom stats, names, or journey flows in real time. Think Spotify Wrapped vibes. INKLUSIVE helps brands add personalization that feels magical, not creepy.
Following infographic best practices is one thing. Having a pro team do it for you? Game-changer. INKLUSIVE blends design precision with storytelling to build infographics that perform.
Why INKLUSIVE Is the Go-To for Custom Infographics in 2026
At INKLUSIVE, we don’t just make visuals — we craft high-performing content tools that simplify complexity and supercharge results. Whether it’s a data-heavy financial infographic, a scroll-stopping sustainability report, or a motion-based product explainer, we’ve done it all for leading global brands, and with real ROI.
We’re experts at turning chaos into clarity and information into interaction. From eBooks to dashboards to interactive one-pagers, our custom infographics have helped clients:
- Increase engagement by 67% across platforms
- Cut customer support tickets by 40% with visual FAQs
- Boost landing page conversions by up to 3x with data-led designs
- Improve training retention by 55% using visual SOPs and onboarding content
- Land investor meetings faster and close deals with visual pitch tools
- Save 20+ hours/month on reporting with automated infographic templates
No templates. No fluff.
Just tailored infographic examples for businesses that move the needle and look good doing it.
Ready to create the best infographic designs that perform as good as they look?
Let’s turn your information into inspiration.
Reach out to INKLUSIVE for your next infographic project.
Final Thoughts
At the end of the day, great infographic design does more than just look pretty — it performs and effectively present data. Whether you’re simplifying data, launching a product, or pitching to investors, a well-crafted visual can be the difference between being skimmed and being remembered. The best infographic examples aren’t just eye candy — they’re clarity tools, trust builders, and conversation starters.
As 2026 unfolds, embracing modern infographic design trends like motion graphics, AI visuals, and personalization will keep your content future-ready and scroll-stopping. But never forget the fundamentals: infographic best practices like simplicity, white space, and clear messaging will always win.
So, whether you’re educating, selling, or storytelling, use infographics with intent. Because when done right, they don’t just inform… they influence.
Still thinking about how to design an infographic that works in 2026? Here’s a good rule: Don’t stress. INKLUSIVE got your back with bold ideas, smart visuals, and serious results.
Ready to Turn Information Into Influence?
If you want infographics that go beyond visuals to simplify, engage, and drive action, INKLUSIVE can help you create designs that truly perform.